

May 14, 2014
SAS Takes on Spark with In-Memory Analytics for Hadoop

Don’t look now, Spark, but the big dog in the data analytics space, SAS, is staking an in-memory claim in Hadoop. Over the past two months, the North Carolina analytics giant has quietly given data scientists powerful new tools for building, managing, and running predictive and prescriptive data models within the confines of Hadoop.
The need for speed on Hadoop has given rise to in-memory frameworks, such as Apache Spark, that are able to process data much faster than the traditional MapReduce framework. Databricks, the company behind open source Spark, has been a hot commodity recently, inking deals with Hadoop distributors Hortonworks, Cloudera, and MapR Technologies, who are eager to capitalize on the shift to in-memory processing.
The SAS in-memory Hadoop offensive is situated around two products: SAS In-Memory Statistics for Hadoop, which shipped in March, and Visual Statistics, which SAS announced yesterday and ships in July. Both products are powered by the same backend LASR Analytics Server residing in Hadoop. Visual Statistics engine also runs on enterprise data warehouses from Teradata, Oracle, and Pivotal/Greenplum, giving it write-back and update capabilities that HDFS lacks.![]()
The SAS products provide the full lifecycle of big data analytic capabilities, specifically tailored around using advanced algorithms to build predictive and prescriptive models, such as for recommendation engines, explains Wayne Thompson, chief data scientist at SAS.
“For Hadoop, we really are the only analytics solution out there that’s in-memory and covers the full data spectrum, from doing data management to data summarization and data profiling,” Thompson tells Datanami.
The offerings automate much of the data wrangling and variable selection that must be done before getting to the main attraction. They also assist with the process of testing the various models against each other in “challenger tournaments.”
The products bring the power of SAS’ C-based analytic engines to data stored within HDFS, but bypasses MapReduce. By keeping it in memory, SAS eliminates the need to write the data back to disk, enabling users to get answers back faster and ultimately test more iterations of the model, Thompson says.
“The advantage of SAS is we can do all that without moving outside of Hadoop,” he says. “We can read the data just once into memory and go through that full analytical lifecycle. No other vendor is doing that. There’s some open source work going on out in California with the Spark project that has some of these kinds of capabilities, but none of the other vendors are doing this.”
SAS re-engineered the algorithms to execute in memory in Hadoop, or within enterprise data warehouses, in the case of Visual Statistics. The company also added a handy new feature in Visual Statistics called “group by” processing that will allow data scientists to churn out data models by the dozen as part of a “data model factory.”
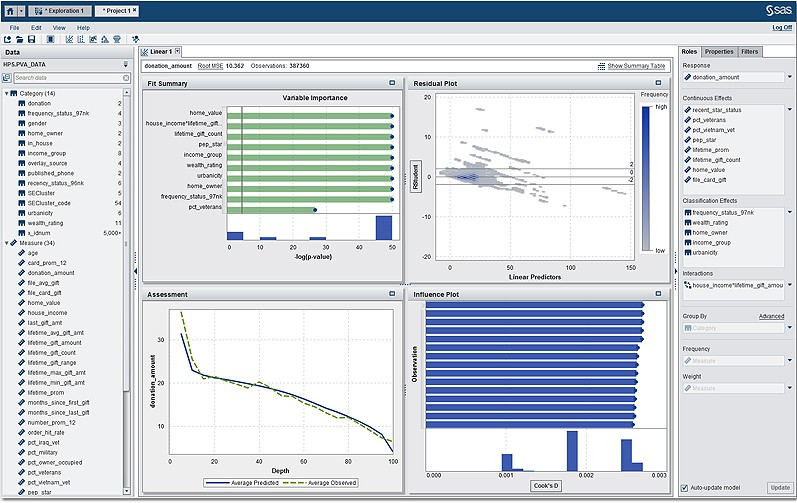
Data scientists can view the results of multiple linear regressions in Visual Statistics
Thompson says “group by” processing will be useful to large retailers who want to build models for each store. “If I want to develop a predictive model to look at purchase propensity, or my affinity to buy a certain product with a promotion, and I want to do that on a per-store basis, we can actually build a second model for all those thousands of stores with the single click of the mouse–and we do it lickety-split,” he says. “No other software that I’m aware of, within SAS or outside of SAS, allows you to build these model factories like we do.”
SAS is targeting hardcore data scientists who like to code with the In-Memory Statistics for Hadoop product. “Our mission with that product is to make it the number one analytic product on the Hadoop platform. That’s our goal,” Thompson says. “We’re proud to be part of the Hadoop community.”
While it eschews MapReduce in favor of its own code to perform the base multi-path iterative analytics, SAS is using other components of the Hadoop ecosystem, including Sqoop and Hive, within the products. It also uses MapReduce to perform certain data management tasks, Thompson says.
SAS uses MPI instead of MapReduce as the core data communications backbone for its in-memory Hadoop products. “The problem with MapReduce is one node can’t talk to another,” Thompson says. “If I’m trying to do analytic computation, and I’m trying to minimize some kind of residual–some kind of mean square estimate or something–those nodes can work together to reach the solution, so that’s a big advantage to why we’re quicker.”
Visual Statistics also includes a number of visualizations, such as graphs and heat maps, that will help data scientists see what their models are generating. Like SAS Visual Analytics tool that shipped a year-and-a-half ago, the company focused on making Visual Statistics intuitive and easy to use. “They’re actually fun to use,” Thompson says. “We’ve really taken the presentation level of these products and tightened them up quite a bit and did a lot of usability work with our customers.”
The Visual Stats package doesn’t offer the same depth of exploratory capabilities as Visual Analytics. That product, which is now used at more than 1,300 sites, is targeted more at data analysts than data scientists. But the idea is that many SAS customers will elect to use both products to perform their data science tasks.
SAS has a long history in the field of advanced analytics and statistics, a history that predates Hadoop by decades. The fact that SAS is taking steps to enable its products to work with Hadoop and take advantage of the innovation that’s taking place on that platform is going to be good for SAS customers, and likely good for SAS itself.
Related Items:
SAS and IBM King of Analytics Hill, But for How Long?
Apache Spark: 3 Real-World Use Cases
HortonWorks Reaches Out to SAS and Storm
Technologies:
Middleware
Vendors:
SAS
Leading Solution Providers


Tabor Network
Sponsored Multimedia


Featured Events
-
AI & Big Data Expo North America 2024
 June 5 - June 6Santa Clara CA United States
 -
CDAO Canada Public Sector 2024
 June 18 - June 19
 -
AI Hardware & Edge AI Summit Europe
 June 18 - June 19London United Kingdom
 -
AI Hardware & Edge AI Summit 2024
 September 10 - September 12San Jose CA United States
 -
CDAO Government 2024
 September 18 - September 19Washington DC United States