

September 24, 2020
QDA Miner 6 Powers Businesses with New Qualitative Analysis Capabilities
MONTREAL, Quebec, Sept. 24, 2020 — Provalis Research, the leading provider of text analytics solutions, announces the release of version 6 of QDA Miner. The latest release of this qualitative content analysis tool focuses on features that enable market research analysts to quickly and easily transform unstructured content into meaningful business analytics. Designed for everyone, the tool democratizes data analysis for all levels of expertise, from novice researchers to professional data analysts, with the primary goal of improving productivity in analysis and for evidence-based decision-making.
“With the ongoing uncertainty associated with the COVID-19 crisis, clients and prospects are approaching us to assist them in addressing their text analysis challenges,” says Normand Peladeau, President of Provalis Research. He adds, “Being able to uncover this valuable information, which is normally overlooked due to the heavy workload of daily procedures, delivers a great boost for the informed decision-making process and to a business’s bottom line.”
The newly introduced capabilities of QDA Miner 6 are geared towards improving the content analysis process for tagging, annotating, retrieving, and analyzing small and large collections of text data including customer feedback, surveys, focus group and interview transcripts, legal documents, journals or articles, speeches, and other visual documents such as photographs and images. To expedite the coding of open-ended content such as support cases and survey responses, version 6 includes the grid display mode, where data is organized in a table format that allows research analysts to view data clearly and to categorize it with a drag & drop interface that provides a better understanding of the major support issues that need to be addressed.
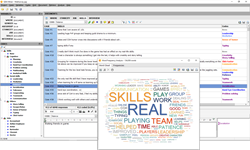
When it comes to visualization of the data analysis, version 6 improves the display of the content analysis results using new features such as an interactive word cloud diagram and a sophisticated quotation matrix. The interactive word cloud “translates” text analytics weighting to various coded data, thus offering the ability to create active word clouds resulting from different analysis features. By removing selected “noise” words or changing the attributes to obtain an accurate understanding of the analyzed unstructured content, research analysts can dynamically change the word cloud in as little as 1-2 clicks. Moreover, the new quotation matrix format enables data analysts to, for example, analyze open-ended product reviews and categorize them by topics and client segments. This enables businesses to identify commonalities within a large set of imported unstructured content, whether comparing product reviews, or even the business position in relation to current competitors. These visual representations are quick to generate and easy to edit when delivering presentations to business colleagues. If further visualization capabilities are required, you can now also export results to Tableau Software.
While excellent data analysis and visualization is paramount, it is also vital to have the flexibility to import data from various data sources. In addition to popular web survey platforms, reference management tools, email sources, and social media, marketing data analysts can now import publication excerpts from common content aggregators such as Factiva and LexisNexis and quickly analyze publication mentions to extract the critical components that directly relate to their core business or subject matter.
Extensive changes have also been made to better handle projects with multiple languages including Asian languages (Chinese, Japanese, Thai, etc.). As a consequence, all retrieval and analysis features have been modified to support the display and analysis of text in many more languages.
A complete list of the new features can be found on the QDA Miner 6 What’s New page, or you can download a 30-day free trial version to assess the new qualitative data features. If you would like to learn how the new version of QDA Miner can help your organization, please join us on October 14, 2020, for a complimentary webinar on the QDA Miner 6 product.
About Provalis Research
Provalis Research is a world-leading developer of text analysis software with groundbreaking qualitative, quantitative, and mixed methods programs. Developing text analysis programs for over 30 years, including WordStat, QDA Miner, SimStat, and ProSuite, Provalis Research has a proven record in designing and bringing tools to market that have become essential to researchers and analysis specialists worldwide.
Headquartered in Montreal, Canada, the company was founded in 1989. Provalis Research software products are used by more than 6,000 institutions in 5 continents within a wide range of applications such as business intelligence, market research, political sciences, media analysis, survey analysis, risk and fraud detection, and international crime analysis.
Source: Provalis Research
Leading Solution Providers


Tabor Network
Sponsored Multimedia


Featured Events
-
AI & Big Data Expo North America 2024
 June 5 - June 6Santa Clara CA United States
 -
CDAO Canada Public Sector 2024
 June 18 - June 19
 -
AI Hardware & Edge AI Summit Europe
 June 18 - June 19London United Kingdom
 -
AI Hardware & Edge AI Summit 2024
 September 10 - September 12San Jose CA United States
 -
CDAO Government 2024
 September 18 - September 19Washington DC United States