

March 26, 2024
Virtualitics Helps Oncologists Answer Tough Flu Question

(Lightspring/Shutterstock)
Do flu outbreaks correspond with a greater chance of dying for lung cancer patients? It may seem like a straightforward question at first, but once you dig into it, you realize it’s not so easy to answer. But thanks to a multi-disciplinary project involving researchers at Columbia Medical School and the big data analytics software and expertise from Virtualitics, the result turned out to be both clear and compelling.
Oncologists have long theorized that influenza outbreaks pose a particular threat to lung cancer patients. After all, flu and flu-like illnesses tend to target the upper respiratory tract, which is an area of stress for lung cancer patients. However, oncologists have lacked empirical evidence showing that bad flu outbreaks correspond with an uptick in deaths among lung cancer patients. That is, until now.
Thanks to a joint research project by researchers at the Columbia Medical School and data scientists working for Virtualtics, oncologists now have a better grasp of how influenza outbreaks impact lung cancer patients. The study, which was documented in a 2023 paper in the journal Scientific Reports, showed that lung cancer patients have a 25% greater chance of dying during severe flu outbreaks compared to periods when the spread of flu is low.
The robust results pleased Dr. Simon Cheng, the Columbia Medical School oncologist who led the study.

Simon K. Cheng M.D., Ph.D. is the Residency Program Director and Assistant Professor of Radiation Oncology at New York-Presbyterian/Columbia University Irving Medical Center
“We were hoping to come up with something interesting, obviously, and that we could make the right correlations,” Dr. Cheng told Datanami. “[But] we didn’t expect to see something that high. I think that was very surprising.”
The study was also a victory for Virtualitics, the Pasadena, California analytics firm that was spun out of a California Institute of Technology astronomy data lab. The company has found success applying its blend of analytics, machine learning, and visualization tools with military and government customers, and this win shows it has something to offer the medical field too.
“We brought the software and the AI expertise, and we came up with a problem that they were interested in exploring further,” Virtualitics CEO and co-founder Michael Amori said. “They had the data related to it, and so we just partnered up said, hey let’s see if we can find something interesting that might actually do some good as well, and to also prove that our platform really is very powerful and can be used also in healthcare.”
Multi-Variate Analysis
What made this study challenging was that it sought to identify correlations between two data variables–incidence of flu and lung cancer–in populations over both time and space, Dr. Cheng said.
“When we do these analyses, it’s hard to look at all the variables at once and seeing what stands out, and so that’s the reason why we collaborated with Virtualitics,” Dr. Cheng said. “They were able to pinpoint certain things.”
The non-small cell lung cancer data came from the government Surveillance, Epidemiology, and End Results (SEER) database. When somebody is diagnosed with cancer, it must be reported to the registry, said Columbia Medical School oncologist Dr. Connor Kinslow. “There’s a number of quality control checks, so in general the quality of the data is very high,” Dr. Kinslow said. “This is a database that is really the gold standard for cancer data collection.”

Distribution of high flu months over the study period. Y-axis corresponds to the total number of states with high ILI activity during a given month and year. (Image courtesy Scientific Reports)
The study used flu data from the Centers for Disease Control and Prevention. Every week, the CDC collects data on flu and flu-like illnesses across a network of 3,500 providers as part of the U.S. Outpatient Influenza-like Illness Surveillance Network (ILINet). The incidence of flu was broken down by severity into low, medium, and high ranges.
To properly compare the two datasets, the researchers had to find a common denominator. While the flu data was provided at a weekly interval on a state-by-state basis, the SEER data was provided at a ZIP Code granularity, but only on a monthly cadence. Therefore, the core unit of measure that the Columbia researchers used was a state-month, Dr. Kinslow said.
Actually merging the two data sets was a whole other issue. “Utilizing some of these databases does take a fair amount of coding skills because the data may be broken up across many Excel spreadsheets or many different files,” he said. “Just wrangling all that data and merging it together takes a fair degree of skill.”
The researchers had help from a computer science Master’s degree student at Columbia who contributed to the data wrangling effort.
Hunting Correlations
Once the data was loaded, standardized, and prepped on a large cluster running in the cloud, the Virtualitics data scientists could apply the company’s proprietary software.
“What Virtualitics did was they used a fairly sophisticated mathematical technique, where they took…about 10,000 samplings during each state-month and then plotted the density and compared those statistically,” Dr. Kinslow explained. “They also helped us overcome some sort of biases within the data.”
The Virtualitics software, which was originally designed at Caltech to analyze astronomical data, contains many built-in machine learning algorithms. The software runs the algorithms against the data and automatically determines which algorithms are the best fit for the data. What sets Virtualitics apart from other products is how it explains what it’s doing, Amori said.
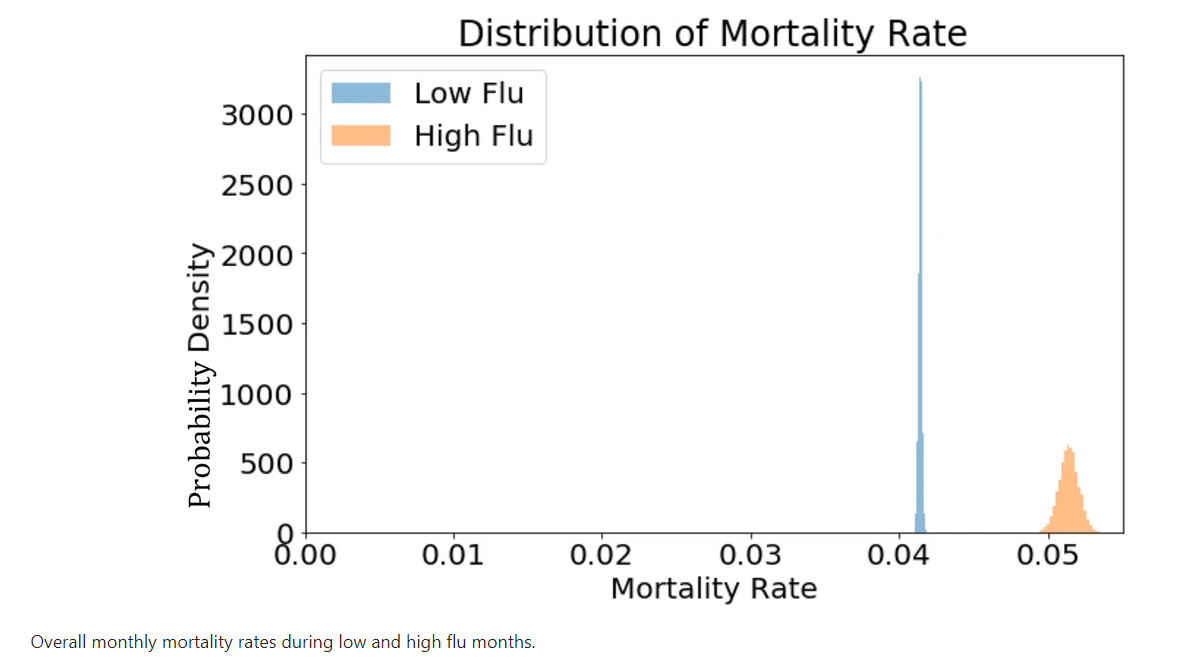
(Image courtesy Scientific Reports)
“Our platform uses AI-guided visualizations of complex data and really focuses on explainable AI, meaning the AI spits out explanations for the pattern that it sees in the data,” he said. “That allows you to really query the data much faster and in an explainable way, so that you really understand what the AI is doing.”
Perhaps the biggest contributions Virtualitics made were the visualizations, according to the Columbia scientists. The combination of the Virtualitics software in the hands of capable company data scientists helped deliver compelling visualizations that demonstrated the increase in excess mortality among lung cancer patients during periods of high influenza. The company also developed a movie that showed the data over time.
“It’s pretty cool,” Dr. Kinslow said of the movie, which can be viewed in the supplemental materials section of the Nature study here. “It’s a time-lapsed map of the US where it actually overlays influenza outbreaks with the lung cancer mortality. And that is a great visualization for basically our main result that you can visually see the correlation over time and space.”
Positive Results
The study was a win for the researchers, for Virtualitics, and for cancer patients. Studies show that cancer patients are vaccinated against influenza at about the same rate as the general adult population in the U.S., or about 40%. This study suggests that the death rate of lung cancer patients during flu season could be reduced if more patients got a flu shot every fall.
The fact that Virtualitics could contribute its software and expertise in the furtherance of science feels good, Amori said. But AI has a lot more to contribute, he said.
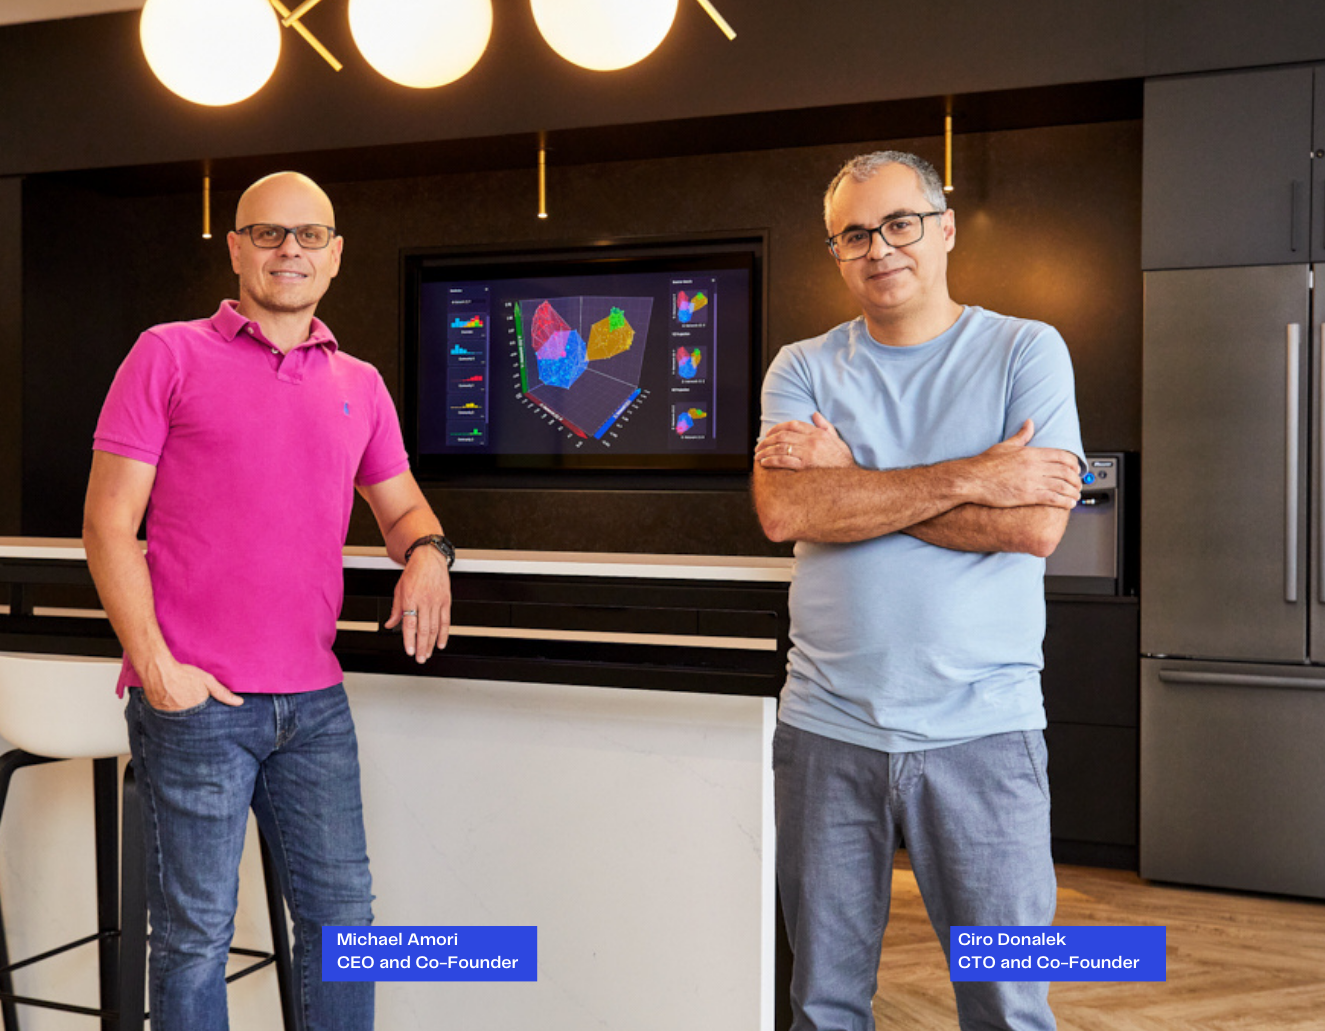
Virtualitics Co-Founder and CEO Michael Amori (left) and Co-Founder and CTO Ciro Donalek (image courtesy Virtualitics)
“I read that it usually takes about on average 17 years for new discoveries in medicine to make it into mainstream medicine, so that’s not good,” Amori said. “But you’ve got to start somewhere, and I think the power of AI is incredible. If you know how to marshal it, if you’ve got the right platform, the right resources, you can find really useful things that can help the world.”
Dr. Cheng also sees a future for AI in medical research. While AI has often been touted as a savior in this field, there have been many more failures than successes. But this victory could help pave the way for more success down the road.
“The way the platform allows you to make sense of the data and to visualize the data, it really showed us that there’s a lot of opportunity out there,” Dr. Cheng said. “In healthcare data and EMR data, there’s a lot of information. There’s a lot of variables, and it’s very difficult to make sense of what is the most important thing. The idea of just trying to throw all the variables into a box and somehow try to visualize it and maybe see which one is the most impactful, most important factor, is very valuable.”
Related Items:
Virtualitics Takes Data Viz Tech from Stars to Wall Street
Air Force Looks to AI to Help Maintain Bombers, ICBMs
Two Cancer-Fighting Startups Gain a Foothold in AWS
Editor’s note: This story was corrected. The study of cancer patient deaths during flu outbreaks was published in Scientific Reports, not the journal Nature. Datanami regrets the error.
Applications:
Artificial Intelligence
Technologies:
Middleware
Sectors:
Biosciences
Vendors:
Virtualitics
Leading Solution Providers


Tabor Network
Sponsored Multimedia


Featured Events
-
AI & Big Data Expo North America 2024
 June 5 - June 6Santa Clara CA United States
 -
CDAO Canada Public Sector 2024
 June 18 - June 19
 -
AI Hardware & Edge AI Summit Europe
 June 18 - June 19London United Kingdom
 -
AI Hardware & Edge AI Summit 2024
 September 10 - September 12San Jose CA United States
 -
CDAO Government 2024
 September 18 - September 19Washington DC United States