

June 13, 2023
Grafana Community Celebrates 10 Years, New Dashboards in V10
You can’t use Grafana without interacting with dashboards. Twenty million Grafana users will tell you that. And with Grafana 10, which debuted this morning at GrafanaCON on the 10th anniversary of its original launch, you’re going to get many more dashboards to view your logs, metrics, and traces.
Torkel Ödegaard created the first Grafana dashboard back in December 2013, when he was a young Swedish developer trying to visualize his application’s behavior and performance. He grew frustrated by the limitations of existing tools, so, as the old IT adage goes, he decided to build his own.
The open source tool was an instant hit, and it soon became the defacto standard tool for visualizing data gathered by Prometheus. But thanks to its open plug-in architecture, Grafana was not tied to Prometheus and its used spread.
“What’s been remarkable about the success of Grafana is the evolution of the visualization capabilities that have really blossomed as the Grafana dashboard became ubiquitous,” said Ödegaard, who will be giving the keynote today at GrafanaCON, a three-day event in Stockholm that will also be streamed by its host, Grafana Labs.

Grafana creator Torkel Ödegaard
“Grafana isn’t just a visualization front-end for IT infrastructure,” Ödegaard continued. “It’s monitoring all kinds of other environments, from space travel, to distributed agtech farms, to research projects in academia. This is truly a project driven by its users, and it’s incredible how big its footprint has become and how many great new ideas for visualizations and use cases keep pouring in from the community.”
This year’s GrafanaCON also marks the release of Grafana 10. Among the new dashboards that all Grafana users (including open source, Grafana Cloud, and Grafana Enterprise) will see with this release is a new trend panel that’s designed for graphing ascending numeric X-axis data. This feature, currently in preview, will enable more adaptable data visualization, Grafana says.
Grafana 10 also brings a new datagrid panel, which delivers an Excel-like interface that lets you edit and organize your data in each dashboard. This feature is in the experimental stage, Grafana says. The time series panel has been bolstered with the capability to add time regions. The canvas panel is now generally available across all versions of Grafana.
Sharing dashboards with people outside of your organization will get easier with the latest addition to Public Dashboards, which brings support for collapsed rows, hidden queries, and the capability to zoom into panels. Grafana users who pay for a Grafana Cloud Pro or Advanced subscription can now send public dashboards via email.
Finding interesting correlations in multiple data sets will be easier with the new Correlations feature, which is in public preview across all versions of Grafana. Users can tap into Correlations by first defining the relationship between data sources within Explore, and then pivot and link between disparate data source, the company says.
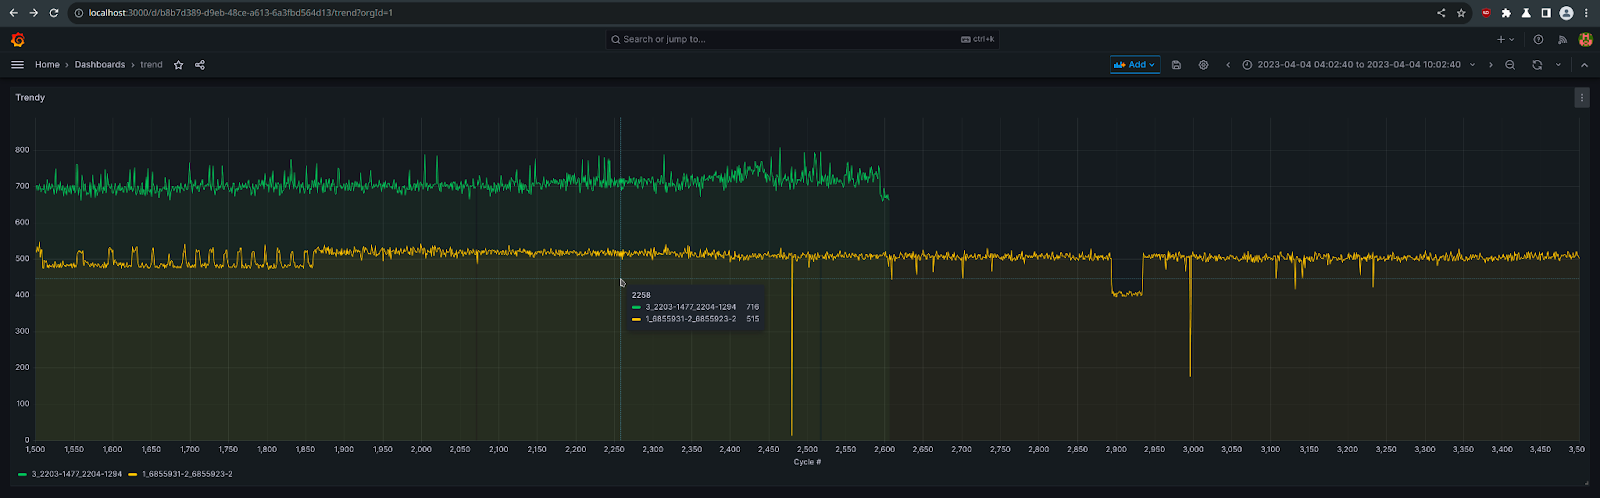
Grafana 10 features a preview of a new trend panel
“So whether it’s application performance metrics in one system, server logs in another, or user activity data in yet another, the unified view of all your data will help create meaningful connections between your datasets,” Grafana’s Quynton Johnson writes in a blog.
Dashboards are ubiquitous in Grafana. But with Grafana 10, users are getting more code-based ways to interact with the product.
For instance, this release brings a public preview for Grafana Scenes, a new library that lets users build dashboards directly into other products. Grafana 10 also brings a improved code libraries designed to make it easier to manage dashboards, as well as a new interface designed for managing dashboards as code.
“We’re also unveiling a revamped version of Grafonnet and an enhanced Terraform provider for composing dashboards,” Johnson writes. “To top it off, our entire framework and as code documentation are going public to ensure no more guesswork when creating dashboards.”
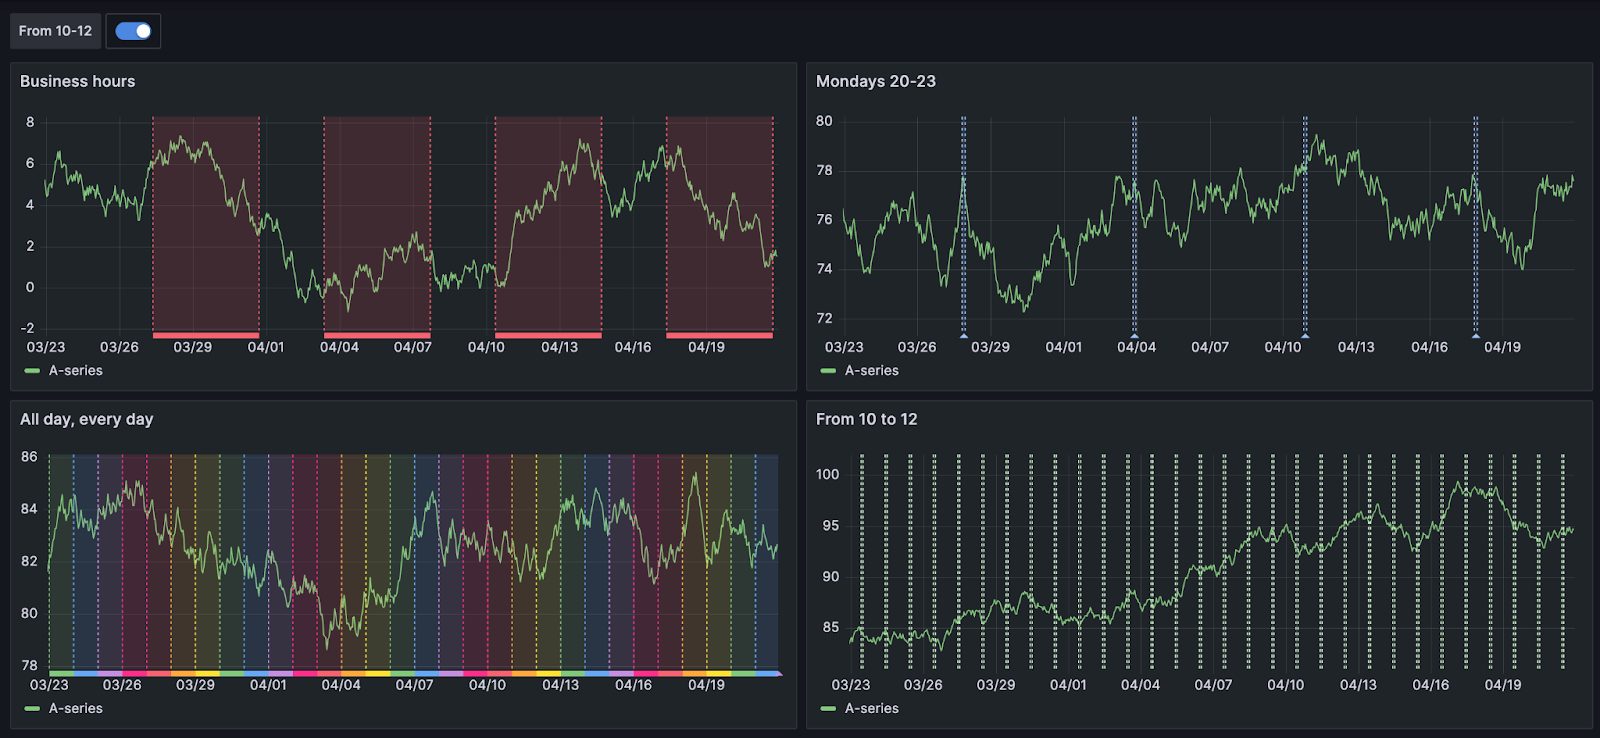
An updated time series panel greets users of Grafana 10
Finally, Grafana is adding a new onboarding experience designed to make it easier for new users to get started with setting up data sources, integrations, and agent configs across all open source, Grafana Cloud, and Grafana Enterprise products, the company says. The user interface also enables users to organize their dashboards using a new subfolders feature.
Grafana users also get new security and privacy capabilities, including a new UI for configuring Security Assertion Markup Language (SAML). Grafana Cloud and Grafana Enterprise users will also get a new private data source connect (PDC) functionality to query sensitive data services without opening your private network to a range of IP addresses.
All told, the new features I Grafana 10 take the observability tool to a new level, says Grafana Labs CTO Tom Wilkie.
“Grafana 10 has elevated the developer UX for observability data so any developer can jump right in and get started connecting data sources, creating dashboards, and sharing and extending these resources to teammates,” Wilkie says in a press release.
Related Items:
Grafana Labs Adds Two New Projects to Its Observability Stack
Grafana Labs Announces $240M Series D Round
Meet Raj Dutt, A 2021 Datanami Person to Watch
Editor’s note: This article has been corrected. Torkel Ödegaard started work on Grafana in December 2013, not June 2013. Datanami regrets the error.
Applications:
Data Management
Technologies:
Frameworks
Sectors:
Financial Services
Vendors:
Grafana Labs
Leading Solution Providers


Tabor Network
Sponsored Multimedia


Featured Events
-
AI & Big Data Expo North America 2024
 June 5 - June 6Santa Clara CA United States
 -
CDAO Canada Public Sector 2024
 June 18 - June 19
 -
AI Hardware & Edge AI Summit Europe
 June 18 - June 19London United Kingdom
 -
AI Hardware & Edge AI Summit 2024
 September 10 - September 12San Jose CA United States
 -
CDAO Government 2024
 September 18 - September 19Washington DC United States