

November 3, 2022
Grafana Labs Adds Two New Projects to Its Observability Stack
Grafana Labs released two new open source projects at its ObservabilityCON 2022, held in New York City this week. Grafana Phlare is a horizontally scalable continuous profiling database, and Grafana Faro is a web SDK that enables frontend application observability.
Grafana Phlare is joining the company’s observability suite which includes Mimir for metrics, Loki for logs, and Tempo for traces. Phlare enables continuous profiling, which Grafana has dubbed the fourth pillar of observability. Continuous profiling data can be a boon for cloud native architecture since performance issues in these intricate systems can be challenging to pinpoint and fix.
“Profiling helps you understand the resource usage of your program, which in turn helps you optimize its performance and cost. The shift to distributed, cloud native architecture, however, has made this more complex, creating the need for continuous profiling, in which information about resource usage is automatically collected at regular intervals across an entire compute infrastructure, then compressed and stored as time series data,” Grafana Labs software engineer Cyril Tovena told Datanami in an email. “This allows you to visualize changes over time and zoom in on profiles that match a period of interest — for example, where CPU time was spent during its period of highest utilization.”
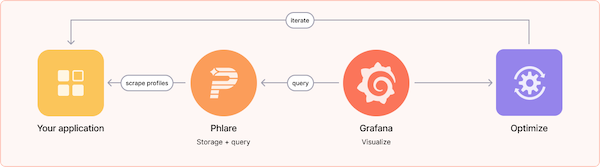
Grafana Phlare allows the storage and querying of continuous profiling data. Source: Grafana Labs
Grafana Labs began using continuous profiling to understand how the software used to power Grafana Cloud was performing: “If we’re paged about a slow query in Mimir, for example, we might use profiling to understand where in the Mimir codebase that query spent the most time. If we’re seeing Grafana repeatedly crash due to out-of-memory errors, we’ll take a look at a memory profile to look at what object was consuming the most memory right before the crash,” said Tovena.
Available open-source continuous profiling solutions did not meet the company’s needs as far as scale and reliability, so the company created its own with Grafana Phlare.
Richard Hartmann, Director of Community at Grafana Labs, says optimizing cloud binaries with continuous profiling can save costs: “The established industry average published by Google and Meta is a savings of 10% in compute cost. At cloud native scale, this is substantial,” he told Datanami. “Profiling is the fourth pillar of observability. No other pillars give you continuous software profiles with direct insight allowing you to optimize your software and infrastructure. It’s the logical progression of observability once metrics, logs, and traces are settled, which is why you are seeing so much movement in this space. It gives you information down to the line of code.”
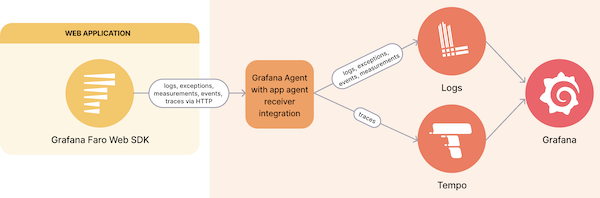
The graphic shows how the Grafana Faro web SDK works for frontend monitoring. Source: Grafana Labs
The second new release, Grafana Faro, enables developers to collect data about the health of frontend web applications. Grafana says this new open source project features a highly configurable web SDK to capture observability signals from web applications, and this frontend telemetry can then be correlated with backend and infrastructure data in the LGTM stack. According to the company, highlights of this release include: quick setup with only two lines of code required, automatic instrumentation to capture errors, logs, and performance metrics, a pre-configured tracing system based on OpenTelemetry with automatic instrumentations, and a user-friendly API for manual instrumentation.
An example use case of Grafana Faro would be a website operator who needs to ensure stable customer access during a large event when traffic will greatly spike, such as Black Friday. The Grafana Faro web SDK, an open source JavaScript library, automatically collects logs, errors, and performance metrics of frontend applications, adds metadata for findability, and then forwards these to the Grafana Agent to be sent to Prometheus, Loki, or Tempo. The company plans to roll out a Frontend Application Observability hosted service, powered by Faro, on its fully managed Grafana Cloud. For now, a private beta program is available for select users.
Grafana Labs also announced new updates for Mimir, Loki, and Tempo. Mimir now supports ingestion of Influx, Datadog, Graphite, and OpenTelemetry metrics. The company says this allows organizations to ingest data from as many sources as possible while leveraging a single query language, PromQL. Loki has a redesigned index for its upcoming 2.7 release that will occupy 75% less space on disk with more efficient access and 4x faster log line scanning at up to 400gb/s. Tempo now has a feature that allows users to troubleshoot k6 test runs with server-side tracing data from Tempo, as well as a new language for querying trace data, TraceQL.
“These days, companies really care that they are able to be online, that their applications are performing fast, that their users aren’t getting annoyed and switching to a competitor. The experience and the quality of that online experience is of paramount importance to everybody. So making sure all the software and infrastructure is running, and running properly, is top of mind for every company,” said co-founder and CEO at Grafana Labs, Raj Dutt in a release. “To support these organizations, we’re launching two brand new open source projects and numerous updates to our Grafana LGTM stack. The team has been innovating a lot the last few quarters, and we’re really looking forward to sharing these latest projects and updates with our community.”
Related Items:
Grafana Labs Announces Mimir Time Series Database
Grafana Labs Announces $240M Series D Round
Meet Raj Dutt, A 2021 Datanami Person to Watch
Vendors:
Grafana Labs
Leading Solution Providers


Tabor Network
Sponsored Multimedia


Featured Events
-
Call & Contact Center Expo
 April 24 - April 25Las Vegas NV United States
 -
AI & Big Data Expo North America 2024
 June 5 - June 6Santa Clara CA United States
 -
AI Hardware & Edge AI Summit 2024
 September 10 - September 12San Jose CA United States
 -
CDAO Government 2024
 September 18 - September 19Washington DC United States