

June 8, 2023
Cable TV’s Latest Hit: Greater Grid Stability
(Inked-Pixels/Shutterestock)
The nation’s electric grids are more vulnerable to blackouts than they used to be. Whether it’s cyber criminals hacking into the grid or the shift to renewable energy sources, electricity distribution is at a critical juncture right now. That’s why a recent project at the National Renewable Energy Laboratory (NREL) that demonstrated how a new source real-time electric grid data–from cable television networks, of all places–gives new hope to grid operators that reliability can be maintained.
Threats to the nation’s infrastructure, including the electric grids, have been on the rise in recent years. Ransomware brought down a key East Coast gasoline delivery pipeline in 2021, while in 2022, a security researcher demonstrated a hack of a smart app developed by Jacuzzi, giving him control over thousands of spas. More recently, vandals equipped with rifles and shotguns have destroyed equipment at electrical substations. The shift to carbon-free energy generation, as well as electric vehicle (EV) mandates, adds further stress to the grids (more on that in a minute).![]()
Getting better and faster insight into potential problems occurring on the grid has become a national priority in Washington D.C. In 2019, the National Renewable Energy Laboratory (NREL) began the Situational Awareness of Grid Anomalies (SAGA) project. The three-year, $3 million project was funded by the Department of Energy’s Office of Cybersecurity, Energy Security, and Emergency Response commenced, and would seek to provide real-time information on the state of the grid.
The crystalizing moment for the recently completed project was the realization that the last-mile delivery of the electric grid “is essentially blind,” says Scott Caruso, who heads up strategic ventures for CableLabs and who spearheaded the SAGA project.
“For all the talk of sensors and Industrial Internet of Things (IIoT), there’s a distinct lack of visibility into the status of power availability and quality in the last miles of the electrical distribution grid,” Caruso wrote back in 2019.
However, it also happens to be true that the electrical grid coexists with cable TV and broadband equipment. In fact, cable and broadband lines are connected to about 95% of homes in the U.S., and 97% of them have cable within 1,000 feet.

Scott Caruso is the president of Gridmetrics and head of strategic ventures for CableLabs
“That’s kind of the ‘aha’ [moment],” Caruso tells Datanami in a recent interview. “They share the same poles. They’re in the same trenches. They’re literally side by side.
What if that cable TV and broadband infrastructure could be tapped to determine the state of the grid equipment that it’s connected to? That’s what the SAGA project explored, and that’s what was ultimately delivered in a product called Power Event Notification System (PENS) from Gridmetrics, CableLabs’ for-profit arm.
Before the SAGA project or PENS, there was no communications taking place between those two networks, Caruso says. The communication companies were operating all types of equipment that required electricity from the grid, including Wi-Fi hotspots, 5G small cell towards, or broadband fiber optic nodes, but the power (and data) flowed in just one direction.
“Well, it turns out those devices are really commercial-grade, sophisticated UPSs,” Caruso says. “They also have a cable modem inside them. Our data comes from those devices. That’s where all of this stuff started. And in aggregate, today we have hundreds of thousands of those. So when you kind of step back and look at it, what you really have is this first-time ever, independent, holistic view of the power grid.”
Before SAGA, the communications providers polled their power supplies at most 10 times per day. That meant about 2.5 hours could go by between a check on the network–not very useful. Under the SAGA project, that polling was bumped up to once every five minutes, via Simple Network Monitoring Protocol (SNMP). “It sounds like it’s trivial, but it is a big lift,” Caruso says.
Now voltage readings were being collected from hundreds of thousands of points on the grid every five minutes, which resulted in terabytes worth of data, Caruso says. Armed with two years’ worth of this data, the researchers at NREL, CableLabs, and the University of Colorado created a database of expected values. If any of the sensors returned a real-time value that deviated from the expected value, it would be flagged as anomalous behavior that could indicate a cybersecurity event or other cause for concern.
Additional work was done to link the sensors to critical pieces of infrastructure, such as power plants, water reservoir, hydropower systems, or airports, Caruso says. “What we developed was the ability to group the sensors and then look for events that were related to that kind of asset, if you will,” he says.
Suddenly, grid operators had a much clearer and up-to-date view of the grid and where outages were occurring. Utilities no longer had to rely on customers to call in and complain about a power outage, or scan Twitter for similar complaints. It could know by simply monitoring Gridmetrics’ PENS product and its intuitive GUI.
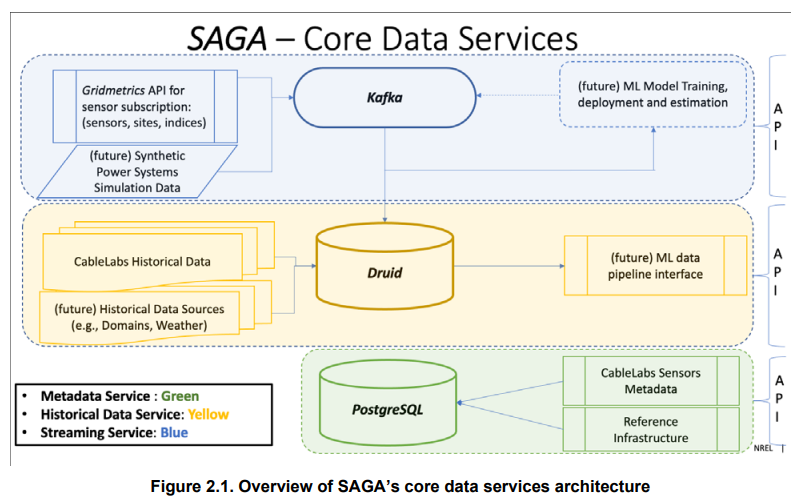
SAGA’s real-time data stack (Source: SAGA report)
What’s more, PENS provided a God-like view of grid behavior–and possible cyberattacks–that cross utility boundaries. The U.S. power grid is composed of 3,200 distinct entities, Caruso says, but with grid-level data coming from communications gear, the cyber entity utilizing a security vulnerability (such as the one discovered in Jacuzzi gear) to manipulate power demand can be detected.
“Take it from a hot tub to somebody who does a thermostat hack, or in the future, EV charging or heat pumps,” Caruso says. “Any one of our utilities would never be able to realize that that was actually a coordinated attack. They wouldn’t see the pattern of behavior.”
That’s how the SAGA project proceeded through its first two years. Then, the project goals pivoted a bit. Instead of polling the communications gear once every five minutes, what if data could be streamed on a continuous basis?
“The first thing was all the work we did about creating the kind of visibility into the power grid and getting events and then looking for anomalies,” Caruso says. “One of the things that came out of that is, gosh, if we could have real-time streaming data and do that same kind of analysis, it’s a gamechanger. That completely disrupts the paradigm.”
If polling every five minutes was sufficient for detecting cyberattacks or outages, what would a continuous stream of data provide? Better balancing of power supply and demand in a dramatically altered grid, is the answer.
The electric grid is undergoing a massive transformation at the moment. On the one hand, utilities are moving to decarbonize their electricity generation by turning off coal and natura gas-burning plants to moving to solar, wind, and hydro power (states like California are also turning off nuclear power).
At the same time, the federal government and some state governments are mandating a shift to electric vehicles, which will require much more energy to flow thorugh grids. Some states are also moving to outlaw the use of gas stoves, putting even more strain on electricity supplies.
Operating a grid in the midst of these huge changes in electricity supply and demand will require much more data, Caruso says.
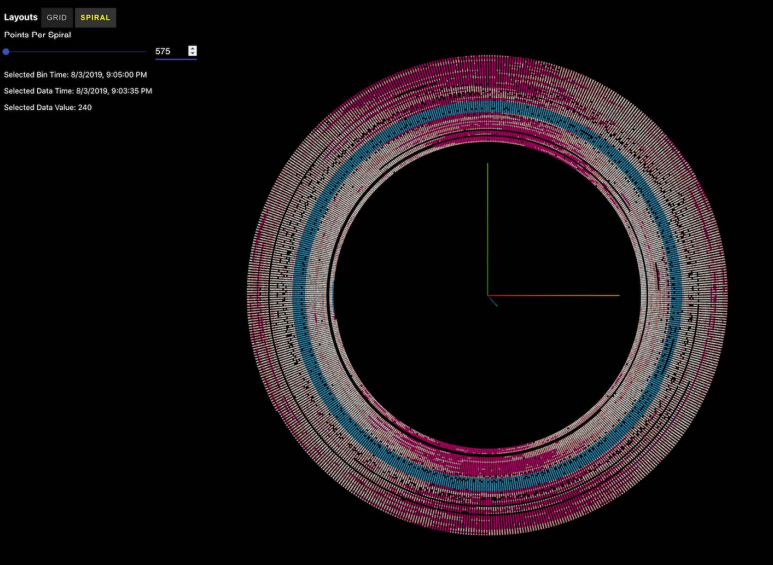
Spiral depiction of time-series data (Source: SAGA report)
“Today’s grid was architected, built, designed, and managed for one-way power flows,” he says. “All of a sudden, move generation over to the edge. We know from the [communications] world, as soon as you move anything to the edge, you’ve got to be able to control it and manage it. That requires some level of visibility and understanding about what’s happening down in the distribution grid, where there fundamentally is a blind spot today.”
Getting real-time visibility into the grid required a completely different collection of technology. According to the paper published by CableLabs and NREL, the researchers created a system that used Apache Kafka to handle the streaming data and Apache Druid to aggregate the fast-moving data. NREL also developed software that provided visualizations and analytics on large amounts of time-series data.
What started as a project to boost cybersecurity took a turn, and SAGA ended with a focus on grid reliability. All told, it was a successful product, one that now provides a basis for GridMetrics commercial software, according to Caruso.
“We started as a mechanism for observing power in the context of grid cyber events,” he says. “Where we’ve ended up is a paradigm for where we can actually enable the real time, all-the-time observability of the power grid. It has an application to grid cybersecurity, absolutely. But it also has an application in grid operations. And that’s kind of the trajectory we’re headed now.”
Related Items:
Duke Energy, GE Tap AWS to Help Balance the Green Grid of the Future
MIT-IBM Watson AI Lab Tackles Power Grid Failures with AI
Can Digital Twins Help Modernize Electric Grids?
Editor’s note: This story has been corrected. NREL developed software for visualizing real-time grid data, not GridMetrics. Datanami regrets the error.
Applications:
Artificial Intelligence
Technologies:
Network
Leading Solution Providers


Tabor Network
Sponsored Multimedia


Featured Events
-
AI & Big Data Expo North America 2024
 June 5 - June 6Santa Clara CA United States
 -
CDAO Canada Public Sector 2024
 June 18 - June 19
 -
AI Hardware & Edge AI Summit Europe
 June 18 - June 19London United Kingdom
 -
AI Hardware & Edge AI Summit 2024
 September 10 - September 12San Jose CA United States
 -
CDAO Government 2024
 September 18 - September 19Washington DC United States