

July 13, 2022
Esri Puts Federal Climate Change Action on the Map
David Hayes, special assistant to the president for climate policy
What is the Federal Government doing about climate change? Quite a bit, it turns out, but nothing tells a story quite like a map, which is why the Feds are using geospatial information systems from Esri to track the changing climate, visualize where it might go, and help people live in it.
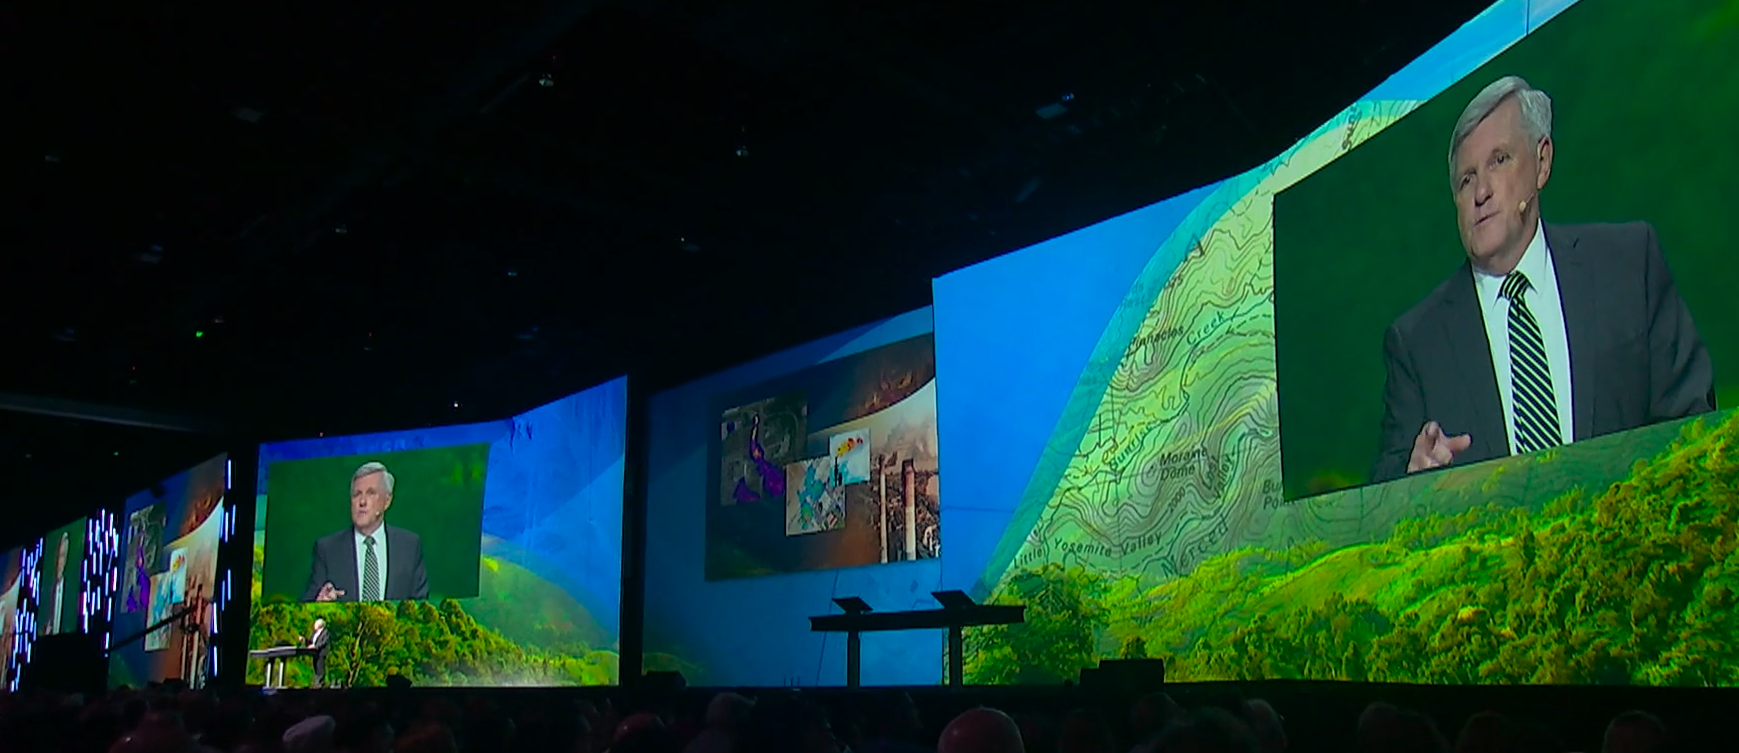
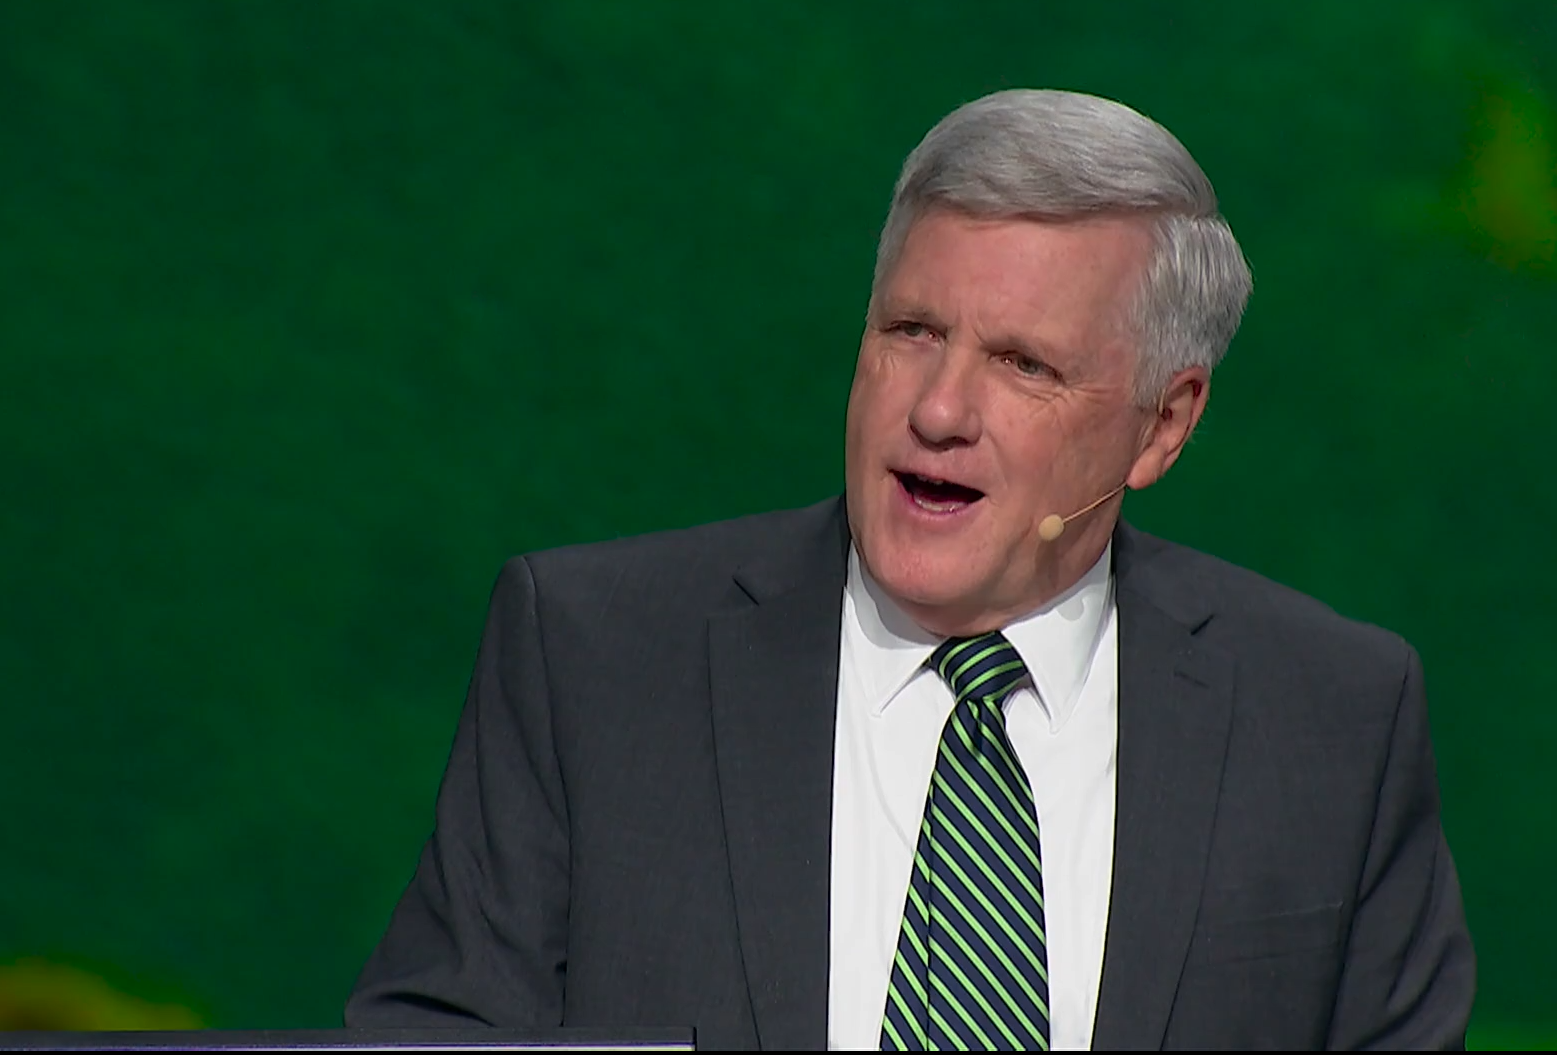
David Hayes, a special assistant to the president for climate policy, is a friend of Jack Dangermond, the CEO and founder of Esri, the leader in geographic information systems (GIS). Not surprisingly, he’s also a fan of maps, which he discussed during his keynote address at Esri’s user conference.
“My proposition to you is geospatial mapping tools may be the most important weapon that we have to fight against climate change,” Hayes said Monday during his UC 2022 keynote, the first in-person conference Esri has held since the start of the COVID-19 pandemic.
As the point man for President Joe Biden’s White House Climate Office, Hayes is tasked with helping to direct tens of billions in funding that Congress has authorized to spend on climate change-related endeavors. Much of this work occurs through the National Climate Taskforce, a group of 25 cabinet-level leaders from across various federal agencies that Biden established just after his inauguration to enact his climate change agenda.
The taskforce has three core goals:
- Reducing U.S. greenhouse gas emissions by 50% below 2005 levels in 2030;
- Reaching 100% carbon pollution-free electricity by 2035;
- And achieving a net-zero emissions economy by 2050.
The group is also tasked with ensuring 40% of the funds the Federal Government spends on climate and clean energy to be spent in disadvantaged communities. GIS plays a role across all of these initiatives, Hayes said.
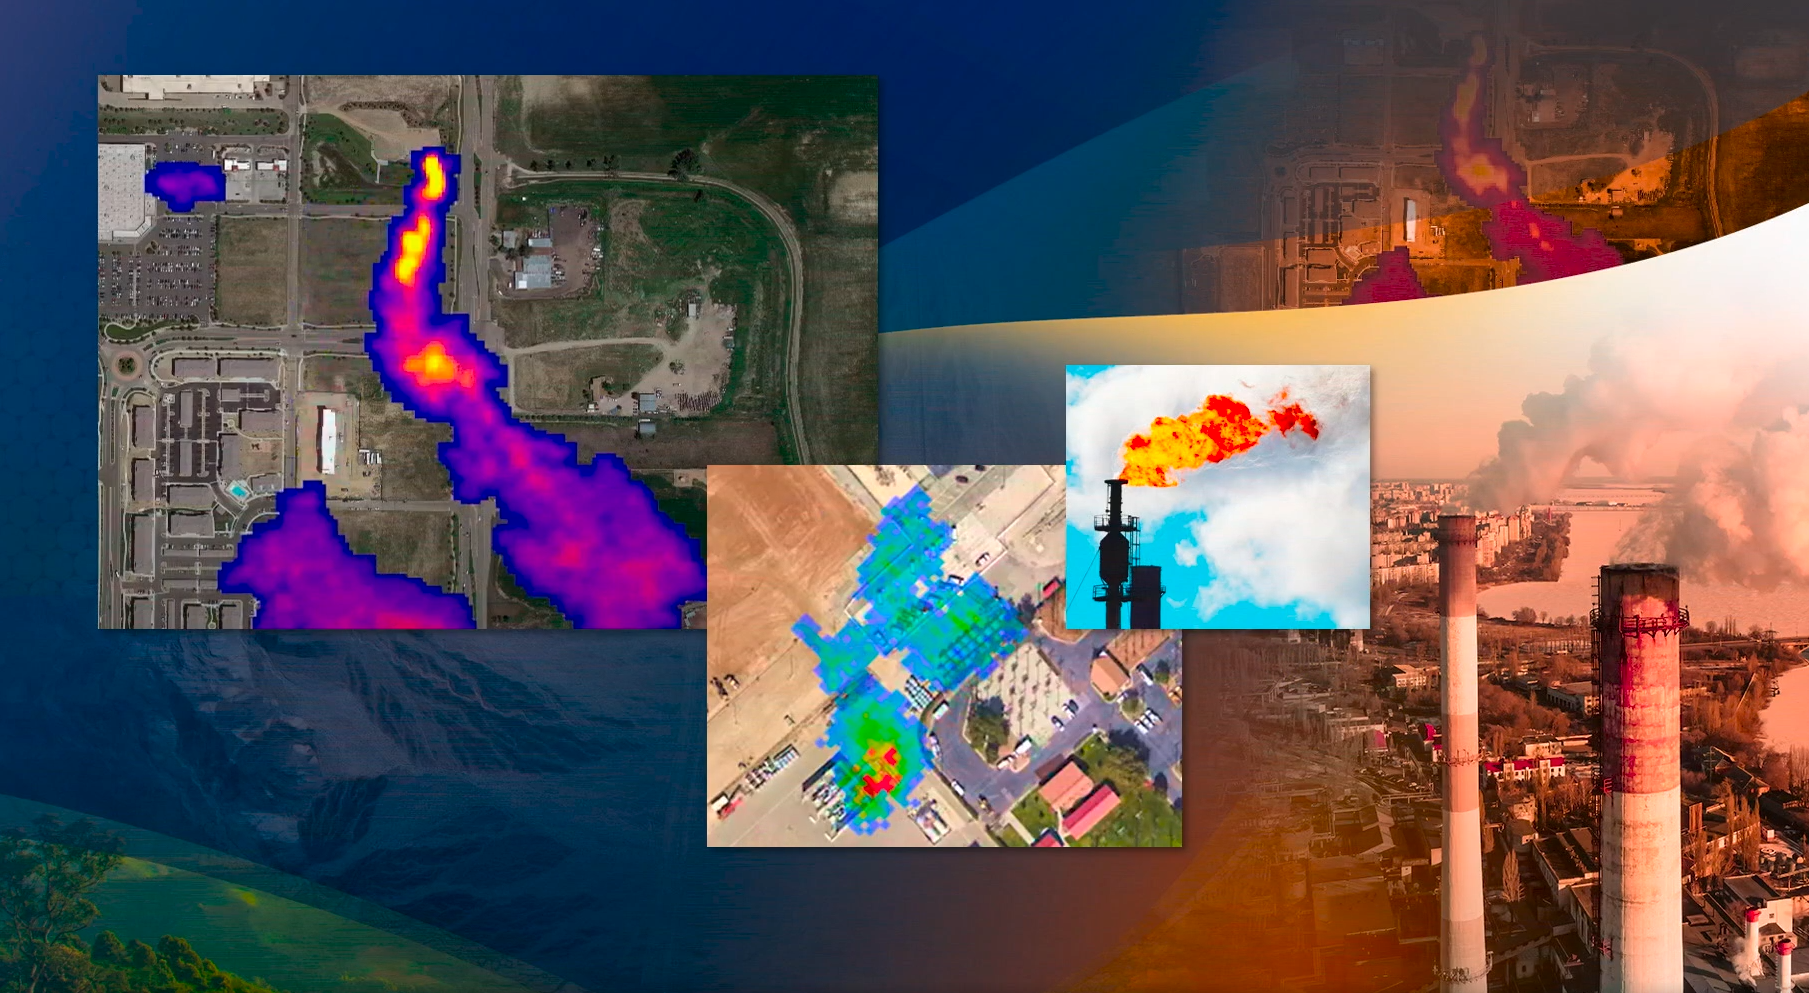
Carbon Mapper tracks the source of CO2 and methane through air and space
Reducing Emissions
Modern maps and mapping tools will assist with the number one goal–getting a handle on greenhouse emissions, such as CO2 and methane. Hayes cited a non-profit group called Carbon Mapper that uses mapping tools to pinpoint the source of these odorless, colorless gasses from air and space.
“Their data collection and geospatial mapping efforts are a model for industry, government, and citizen scientists,” he said.
Natural environments, such as forests and wetlands, have the capacity to absorb up to one-third of the greenhouse gas reductions that President Biden wants to achieve under his plan, Hayes said. But where, exactly, are the suitable lands for this? The answer lies within Landsat, NASA’s land-mapping initiative.
“Is it possible to see these changes on our landscape? Yes, through maps! Three cheers in that regard for the images … from Landsat,” Hayes said. “Landsat has vividly documented climate destructive land conversion over time, an invaluable tool to all of us, now being extended with last year’s successful launch of Landsat 9.”
(It also happens to be Landsat’s 50th birthday this year. “Let’s celebrate!” Hayes said.)
Maps of protected areas are also important for satisfying another one of President Biden’s conservation initiatives, the “30 x 30” plan, which calls for protecting 30% of landmass and 30% of waters by 2030. The plan, also called the “America the Beautiful” act, is being illustrated through maps under a Stewardship Atlas project–powered by Esri’s ArcGIS.
“We’re looking for common ground that many people can get behind,” he said. “We need to see it, to feel it, and to find it on a map.”
Carbon-Free Energy
The second step in Biden’s climate agenda is to accelerate the transition away from fossil fuels and toward green energy, Hayes said.
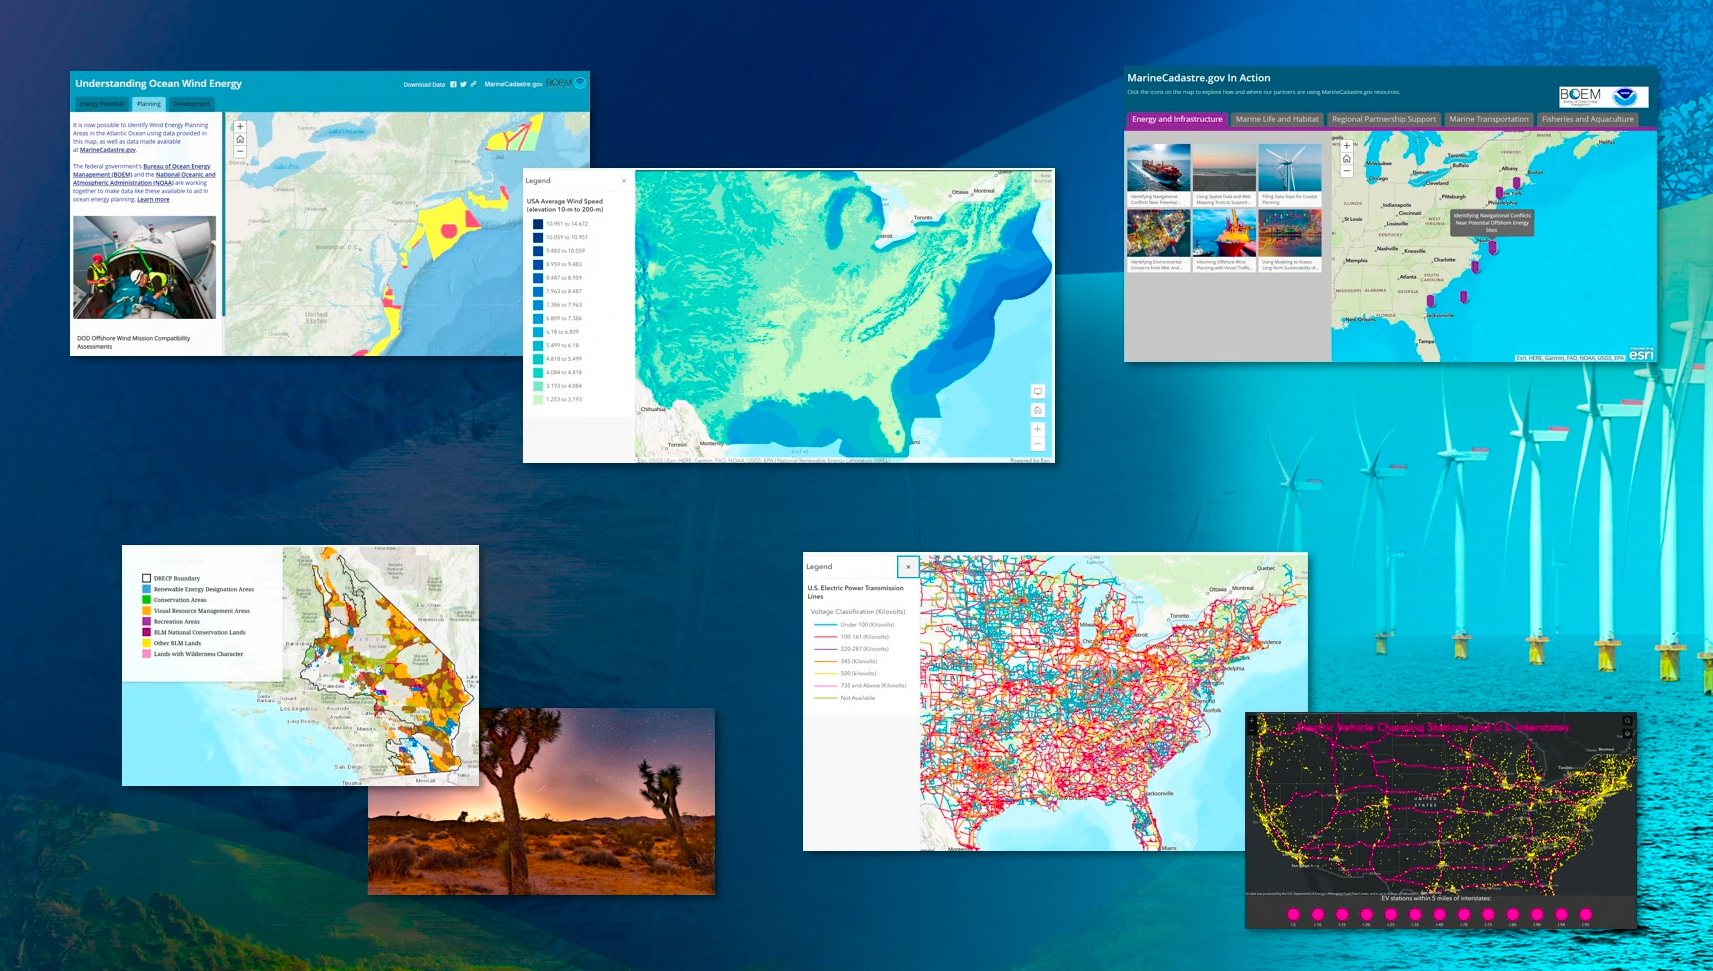
GIS can help with locating renewable energy infrastructure, according to Hayes
“We need smart maps here, too,” he said. “We need to know the strength of the offshore wind resource off the Atlantic coast in the U.S. so we can put offshore wind turbines in the optimal location. We also have to be smart about avoiding conflicts as we lease those waters.”
Maps also inform the placement of “big footprint” initiatives, such as large solar farms in the Mojave Desert, and the new power lines that will connect them to the grid. “We need tens of thousands of new transmission lines to unlock renewable energy resources we have in the Great Plains and Intermountain West. How do we find the best places to put those lines?” he asked. “Again, maps.”
The same goes for electric car charging stations. Congress has allocated $10 billion for new charging stations, and Hayes and his team will be working to figure out where they should go.
Net-Zero Nation
The third leg of the climate stool revolves around resilience and adaptation to the changing climate. Hayes cited a NOAA website that tabulates the impact of climate change. Last year, it recorded $145 billion in damages from 21 “major extreme weather-related disasters,” he said.
Tracking the potential impact of a changing climate is not an easy task, especially considering all of the federal agencies that have a hand in it. To help cut across agency lines and bring the data together in a cohesive manner, Hayes’ office is working with Esri to create a “climate resilience portal.”

Projects for adapting to climate change also rely on GIS, Hayes said
Esri’s Sean Bryer provided a demo of the climate resilience portal. There are maps that show predictions in the spread of extreme heat, as well as the increased chances for flooding. “It’s exciting to hear federal agencies are coming together to develop and share information in support of climate resilience,” Esri’s Sean Bryer said.
Breyer shared another map that shows the impact of dry weather in Fresno County, which is currently on week 83 of the current drought. If the drought continues, about 40,000 jobs that generate $6 billion in economic activity are at risk.
Another map shows that 1.8 million residents in the Las Vegas metropolitan area rely on hydro power, which is increasingly iffy given the historic low water level of nearby Lake Mead. Combining these types of geographic and non-geographic data sets is a specialty that will be put to use in the climate resilience portal.
“Moving from science to action requires a different kind of map, called policy maps–maps made to show impact,” Breyer said.
Hayes sounded grateful for the extra-governmental help.
“It’s not easy to put together such a portal…for the federal government,” he said. “I’m super excited about the tease for climate resilience portal that might bring together excellent information on climate impacts that are happening now, much of which exist in various websites, many of them on different federal agencies’ websites, but which can be hard to find and put together.”
Including Equity
President Biden’s north star is equity, and it has led him to commit to spend 40% of the federal money planned for climate change and resilience on disadvantaged groups, or the Justice40 Initiative, Hayes said. But will the north star be enough to guide reliably spend tens of billions of taxpayer dollars? Probably not.
David Hayes, a special assistant to the president for climate policy, spoke on the need for good maps and GIS tools during his keynote address at Esri’s UC 2022 user conference on July 11 in San Diego
“So how do we identify and locate the disadvantaged communities and check on where the benefits are flowing?” Hayes said. “You guessed it: smart, geospatial maps.”
According to Hayes, the White House’s Council for Environmental Quality has released the beta of a Climate and Economic Justice Screening Tool that will use GIS data to determine if certain groups qualify for the federal money.
The screening tool will use eight main criteria, including: climate impacts; access to clean energy and energy efficiency; clean transit; affordable and sustainable housing; reduction and remediation of legacy pollution; access to clean drinking water and wastewater infrastructure; health burdens; and training and workforce development.
Climate change impacts will vary by geography, so it makes sense to take a geographic-based approach to addressing the challenge, Hayes said.
“What we need is good information to do that planning in the right way and the right place, and that’s where geospatial mapping comes in,” he said. “So let’s spend this money wisely at the local level, where one size does not fit all, where disadvantaged communities in particular have to be paid attention to. So all of you fellow believers in the power of mapping, let’s raise our game, let’s show where the common ground is, and let’s beat climate change.”
Related Items:
Esri Simplifies Developer Access to Location Data with ArcGIS Platform
Esri Boosts ‘Velocity” of ArcGIS for IoT
Big Data and AI Converge in Map to Protect Biodiversity
Leading Solution Providers


Tabor Network
Sponsored Multimedia


Featured Events
-
AI & Big Data Expo North America 2024
 June 5 - June 6Santa Clara CA United States
 -
CDAO Canada Public Sector 2024
 June 18 - June 19
 -
AI Hardware & Edge AI Summit Europe
 June 18 - June 19London United Kingdom
 -
AI Hardware & Edge AI Summit 2024
 September 10 - September 12San Jose CA United States
 -
CDAO Government 2024
 September 18 - September 19Washington DC United States