

March 12, 2020
Tracking the Spread of Coronavirus with Graph Databases

(Rost9/Shutterstock)
In the midst of a global pandemic, big data technologies like graph databases are demonstrating a remarkable capability to model complex interactions among groups of people and places, as well as the trains, planes, and automobiles that take them there.
Coronavirus is having a colossal impact on the lives of billions of people and millions of businesses. Governments around the world are taking drastic measures to stem the spread of the disease, including the United States’ recent travel bans for European and Asian countries and the Italian government’s virtual shutdown of the entire country.
While computer technology alone can’t stop a microorganism like the coronavirus that emerged from China in late December, it can help to give decision-makers better information, which could potentially slow its spread and give governments precious time to prepare their responses.
In particular, graph databases are proving to be valuable tools in modeling the spread of coronavirus. Graph databases were created because they efficiently mirror complex networks of entities. In these types of specialized databases, people, places, and things are treated as “nodes” and the connections between them are called “edges.”
Entity graph databases are excellent at modeling how people interact and influence each other, and how ideas and behaviors travel along social pathways. Once you have modeled those interactions in the database, then you can use it to make predictions.
As it turns out, graph databases are also great for modeling the physical pathways along which infectious vectors like SARS-CoV2 travel through populations (or networks) of people. And once those real-world connections are populated with real-world data, then the graph database can be used to predict how a virus actually traveled, which can be a useful tool for contact tracing.
Epidemic Search
That is essentially what one group of Chinese researchers did with Neo4j, an open source graph database. According to a February blog post, a Neo4j partner in China called We-Yun has built an application atop the Neo4j database that allows Chinese citizens to do a “self assessment” by checking to see if they came in contact with a known carrier of the virus that causes Covid-19.
Epidemic Search was developed by Neo4j’s Chinese business partner, We-Yun (Image source: We-Yun)
The researchers focused their efforts on travel data collected during the period of time when Chinese citizens were returning home from Chinese New Year, according to the blog post (which was an English translation of the original blog post in Mandarin).
“During the Spring Festival (Chinese New Year), returning home to visit relatives and returning to work again had to take planes, trains, coaches, buses, subways, ships, taxis and other means of transportation, and it is inevitable that there are chances people may travel with carriers of the virus, who may or may not show symptoms,” writes the author, Zhi Zhang.
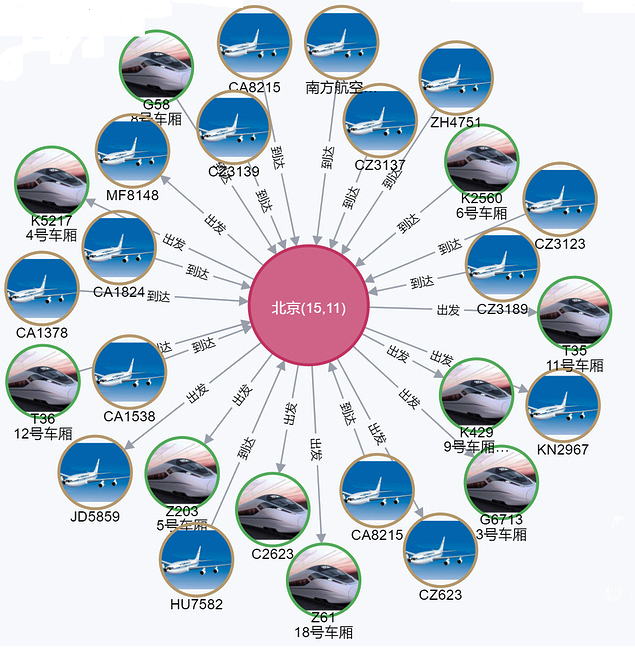
The application that We-Yun built, appropriately called “Epidemic Search,” allows users to enter the name of a place, a flight, a train, or a license plate. The application then returns all known cases connected with the name, Zhang writes. Users can also enter two names, such as Wuhan and Beijing, and the application will show all “edges” that connection them, or flights, trains, and vehicle license plates that traveled between the two cities.
The source data was provided by a public source of coronavirus pneumonia data, and the application was developed in the Neo4j query language, called Cypher.
Complex COVID-19 Pathways
The graph database vendor TigerGraph is giving away licenses for the enterprise edition of its software to Chinese authorities for the duration of the coronavirus crises, according to a recent blog post by Victor Lee, head of product strategy and developer relations for the Redwood City, California company.
Lee recalls how the ideas in an academic paper, titled “Maximizing the Spread of Influence through a Social Network,” could bear on the coronavirus epidemic. The authors describe two potential propagation models, including the linear threshold, “where a target is activated when enough of its neighbors are activated, and independent cascade, where each activated person has a certain probability of activating each of its neighbors.”

(Angelina-Bambina/Shutterstock)
The independent cascade model probably works best, according to Lee, who describes how he would set up such a system. To build a real-world system, however, would require nailing some of the tougher details, he says.
“For serious work, you would want to couple this with models of land-based propagation,” Lee writes. “Here is where it gets much more complex because there is a much higher degree of human interaction. Epidemiologists have existing techniques for these studies, and no doubt some of them are using graph modeling already.”
According to Lee, the graph could model geolocation data as well as “more abstract things,” such as the steps in a screening and quarantine program. “Researchers in the biological sciences are also already using graphs to model metabolic processes and pathways and using subgraph similarity in the search for effective treatments,” he writes. “Bioscientists have driven many of the advances in network analytics. Graph analytics is also providing richer data to train deep learning applications, finding patterns, and solutions that humans overlook.”
Contact Tracing with Nebula Graph
Another project to model the spread of novel coronavirus with a graph database involved the open source Nebula Graph database. This project, which was recently described in a blog post on the Nebula Graph website, also focused on people’s return home from Chinese New Year. But it restricted its efforts to figuring out exactly how five people became infected with the novel coronavirus in just one city, Tianjin.
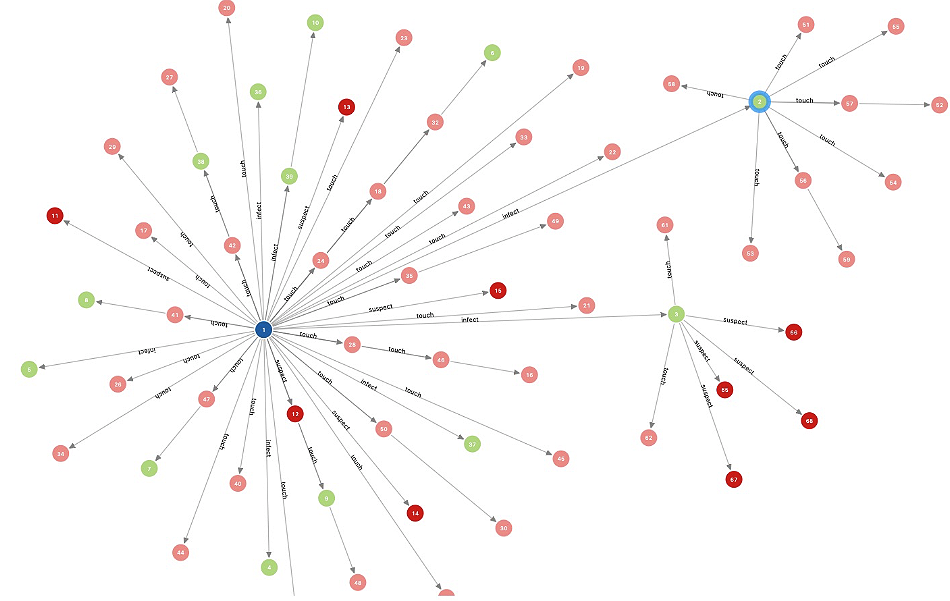
Here are the contacts of five people in Tianjin, as rendered in Nebula Graph
A graph database was prepared to track the properties of two entities – people and places. The graph was loaded with data about people (either healthy or sick), and the physical addresses that people travelled to. The setup was designed to solve a central mystery: Why did user 1 become sick with coronavirus when nobody he or she had come into contact with was sick at the time of contact?
The data eventually traced the contacts back to a known carrier of the novel coronavirus. People infected with the virus can exhibit no symptoms and yet still be contagious, which is a characteristic that has helped it to spread very quickly.
While one may think that a graph database would be overkill for contact tracing the virus’ spread among such a small number of people, the exercise demonstrates the potential power of the graph approach in contact tracing. “Of course,” the author writes, “if you want to observe large amount of vertices, such as tens of millions of potential people and their second and third propagation trajectories, a program with batch queries will be more efficient.”
Related Items:
Tech Conferences Are Being Canceled Due to Coronavirus
Leading Solution Providers


Tabor Network
Sponsored Multimedia


Featured Events
-
AI & Big Data Expo North America 2024
 June 5 - June 6Santa Clara CA United States
 -
CDAO Canada Public Sector 2024
 June 18 - June 19
 -
AI Hardware & Edge AI Summit Europe
 June 18 - June 19London United Kingdom
 -
AI Hardware & Edge AI Summit 2024
 September 10 - September 12San Jose CA United States
 -
CDAO Government 2024
 September 18 - September 19Washington DC United States