

July 25, 2017
Inside Our Data Obsession: A Graphic Depiction

(BEST-BACKGROUNDS/Shutterstock)
Humans are obsessed with data. There’s just no two ways about it. We can’t help but to count, sort, name, and categorize everything we find. And thanks to digital technology, we’ve taken our data fixation to lofty new heights.
Our insatiable desire for data is growing, and there’s even data to back it up. Consider that more data has been generated in the past two years than in the previous entirety of human history, and over the next six months, we’ll collectively generate more data than in all of recorded time previously.
We’re collectively riding this cresting wave of a data tsunami – a Datanami, perhaps – that just keeps growing. The collective pile of data that we’re generating pales in comparison only to the even bigger pile that we’ll create next year, and the year after that, ad infinitum.
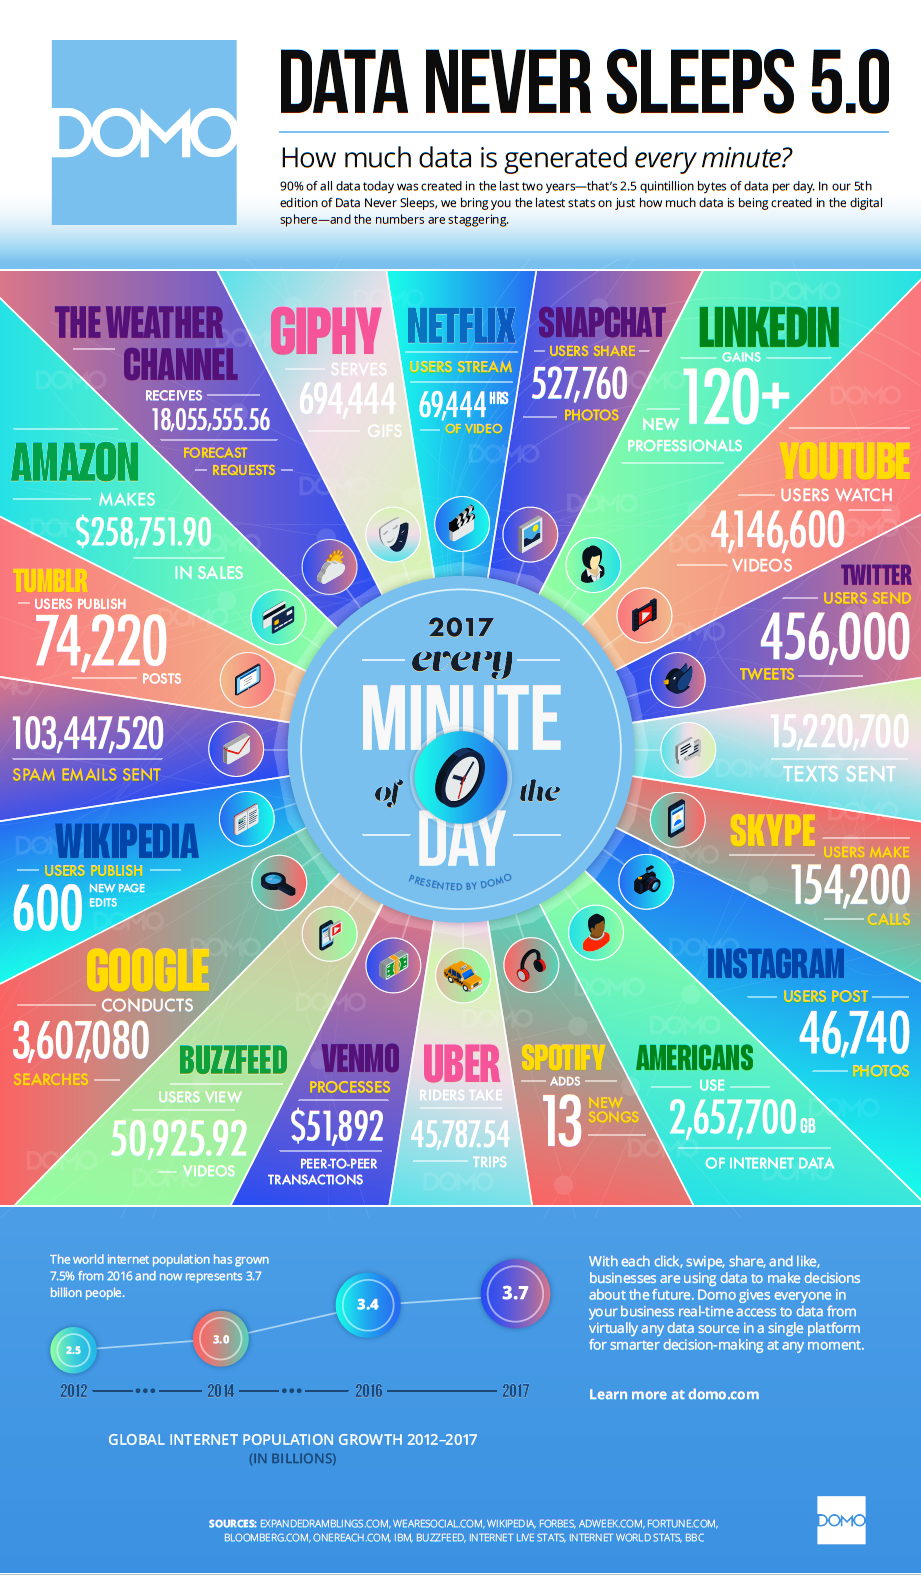
But broken down, what does that huge pile of data actually look like? The folks at data visualization software company Domo took the time to compile some statistics that dive a little deeper into our data obsession.
As part of its ongoing “Data Never Sleeps” series, Domo discovered that, every minute of every day, more than 100 million pieces of spam are sent, more than 15 million texts are sent, about 4 million videos are watched on YouTube, and about 2.6 petabytes of Internet data is sent or received.
Here’s what every minute of a day in 2017 looks like, from the data’s perspective, per Domo:
Leading Solution Providers


Tabor Network
Sponsored Multimedia


Featured Events
-
AI & Big Data Expo North America 2024
 June 5 - June 6Santa Clara CA United States
 -
CDAO Canada Public Sector 2024
 June 18 - June 19
 -
AI Hardware & Edge AI Summit Europe
 June 18 - June 19London United Kingdom
 -
AI Hardware & Edge AI Summit 2024
 September 10 - September 12San Jose CA United States
 -
CDAO Government 2024
 September 18 - September 19Washington DC United States