

July 28, 2016
Tableau Automates K-Means Clustering in V10 Refresh
The upcoming release of Tableau 10 will introduce new features aimed at simplifying how customers use advanced analytic functions upon their data, such as a new k-means clustering algorithm that works in drag-and-drop fashion.
Tableau (NYSE: DATA) is renowned for putting powerful analytic and visualization capabilities into the hands of its users. But that power comes at a cost, including a steep learning curve for some of the more advanced Tableau features.
The Seattle, Washington company is looking to change that perception by focusing on making it easier for customers to use the upcoming version 10 release of its popular analytics and visualization software for desktops and servers.
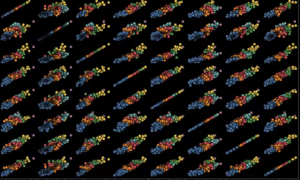
Tableaus’ new drag and drop clustering function, for example, automatically finds patterns in data using a k-means function. A user can call the clustering function by simply dragging it from the Tableau menu onto the screen, where it will automatically sort the data and differentiate their values by color.
By playing with the clustering function, a user can explore patterns in the data that would be tough to pick out with the naked eye. The function allows the user to continually add more variables until the data is sorted in a meaningful way. In addition to numerical fields, the function can support categorical fields.
Tableau users often pull data from different databases, such as Oracle (NYSE: ORCL), SQL Server, and Postgres. Version 10 simplifies this process with a new cross-database join function that can be saved and reused as an extract. There’s also a new cross-database filtering function that lets a single filter be applied to more than one data source, and a new wildcard union that will simplify the process of joining multiple Excel workbooks, including cloud-based sources like Google Sheets.
Other new features including a new “data highlighter” that’s designed to make it easy to view insights while keeping other data in view for context, and a new “custom territories” feature that simplifies advanced geographic analysis.
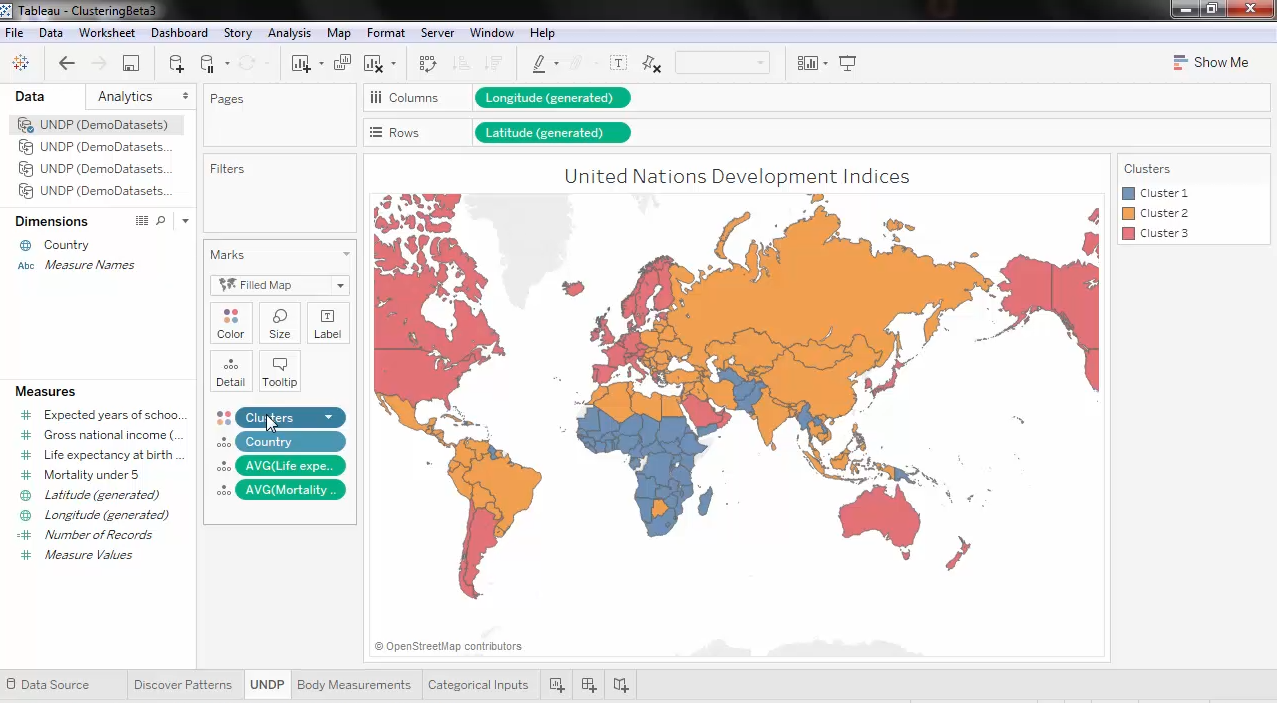
Tableau 10’s clustering function allows users to explore patterns in their data by adding variables one at a time
The company is also shipping new data connectors to simplify pulling data out of Google Sheets, Quickbooks Online, and Kognitio, while it’s close to testing connectors for Presto–the SQL on Hadoop engine developed at Facebook (NASDAQ: FB) and now backed by Teradata (NYSE: TDC)—and MemSQL, a NewSQL database.
Finally, Tableau is delivering data source analytics, which delivers statistics on data source usage in Tableau, thereby giving managers insight into what data sources are trending up in an organization.
“We understand that organizations have data in multiple places,” says Andrew Beers, vice president of product development at Tableau. “So we’ve made preparing and integrating data easier than ever in Tableau 10.”
Tableau 10 also brings new mobile functionality, most notably support for Android phones (it’s hard to believe, but it didn’t run natively on Android OS until now). There’s also a new Device Designer that assures the user that dashboards are rendering correctly, and a new capability that allows developers to create customized views for a variety of devices in a single file, but only publish the file once. The software also supports third-party mobile device management platforms, which can help keep the task of managing lots of disparate phones from getting out of hand.
Tableau is known for enabling customers to create high-fidelity dashboards, and that attention to detail continues in Tableau 10, which features a new color palette and a new custom typeface designed in partnership with renowned typography expert Tobias Frere-Jones. The new Tableau 10 interface “makes it look like you’ve worked with a graphic designer to produce your dashboards,” DePaul University’s Assistant Vice President of Advancement Services Ron Eisenstein says in Tableau’s announcement.
It’s all about putting analytic power into the hands of users, says Tableau co-founder and chief development officer Chris Stolte. “The new design makes data the hero,” he says. “Data integration helps maximize time spent on analysis. Data analytics innovations like the drag and drop clusters, help people do more advanced analysis of their data without needing to program. And enterprise advancements continue to up the standard for delivering a governed, trusted self-service environment.”
Tableau version 10 is exiting beta and is expected to be generally available soon.
Related Items:
Tumultuous Times for BI and Analytic Tool Vendors
Tableau Aims to Speed Analytics with V9
What Color Is Your Data? Inside the Science of Data Visualization
Technologies:
Middleware
Leading Solution Providers


Tabor Network
Sponsored Multimedia


Featured Events
-
AI & Big Data Expo North America 2024
 June 5 - June 6Santa Clara CA United States
 -
CDAO Canada Public Sector 2024
 June 18 - June 19
 -
AI Hardware & Edge AI Summit Europe
 June 18 - June 19London United Kingdom
 -
AI Hardware & Edge AI Summit 2024
 September 10 - September 12San Jose CA United States
 -
CDAO Government 2024
 September 18 - September 19Washington DC United States