

July 20, 2023
Grafana Cloud Debuts Real User Monitoring with Frontend Observability for Enhanced Customer Experience
July 20, 2023 — The frontend of a web application is the part that users directly interact with. It’s the last mile of the digital service you deliver to your customers and it’s directly associated with customer satisfaction and business objectives. Knowing performance metrics such as CPU or memory is helpful, but at the end of the day, what you care most about is if the user experience is affected.
![]() To give you immediate, clear, actionable insights into the real end user experience of your web applications, we are excited to announce the general availability of Grafana Cloud Frontend Observability, our hosted service for real user monitoring (RUM) that extends the capabilities of the Grafana LGTM Stack.
To give you immediate, clear, actionable insights into the real end user experience of your web applications, we are excited to announce the general availability of Grafana Cloud Frontend Observability, our hosted service for real user monitoring (RUM) that extends the capabilities of the Grafana LGTM Stack.
This offering, which is available to all Grafana Cloud users including those in our generous forever-free tier, provides you with the ability to:
- Monitor frontend health.
- Identify, track, and resolve frontend errors.
- Investigate frontend issues with end-to-end visibility.
- Query, correlate, and visualize frontend telemetry in Grafana.
Real User Monitoring Insights Instantly
Modern frontend applications run more code on end users’ devices and thus are increasingly more complex. Users could be accessing your site from a variety of devices, browsers, and operating systems, which makes it almost impossible to always ensure compatibility. Users with different internet bandwidth and CPU may also experience different performance. The increasing number of third-party integrations the frontend depends on adds even more risk of bugs. As more is happening in the frontend, more things can go wrong.
Frontend Observability provides you with an immediate understanding of the actual end user experience by measuring and reporting on Web Vitals, such as Time to First Byte (TTFB), Largest Contentful Paint (LCP), First Input Delay (FID), and Cumulative Layout Shift (CLS), right out of the box in Grafana Cloud. You can also “slice-and-dice” the data across any dimension that makes sense for your business (device type, application version, or session ID) and drill down to see how certain types of users interact with your site.
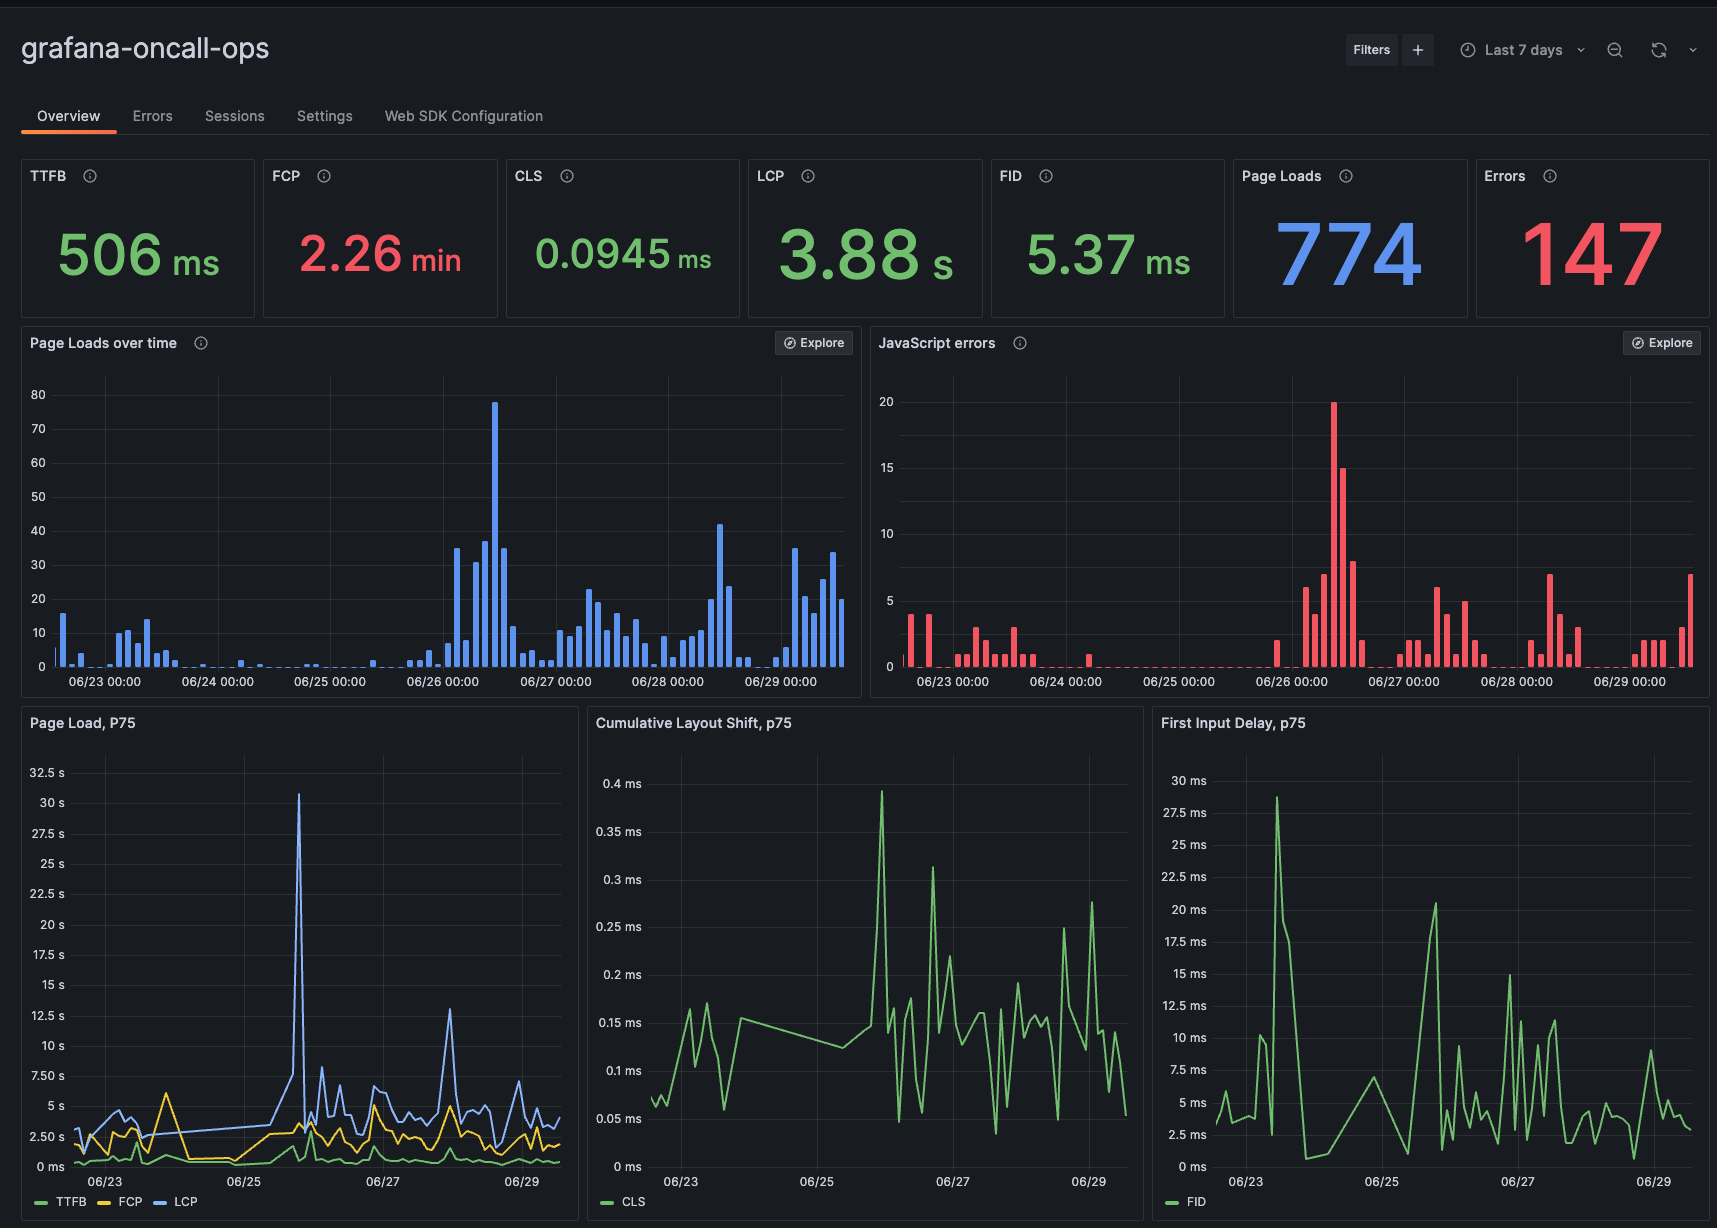
Frontend Observability provides an at-a-glance view of your real end user experience.
Quickly Identify and Resolve Frontend Errors
The frontend can sometimes produce errors, but because they run in a browser, they are harder to track or even find. It doesn’t help that users don’t always report on the errors they experience. And even if they did, the process to get more detailed information can be tedious and cumbersome.
Frontend Observability automatically groups errors based on similarities and ranks them based on volume and frequency for faster troubleshooting. You can then quickly determine which page URLs and browsers have the most errors and investigate each error event with contextual metadata such as device type, application version, session ID, and trace ID. Frontend Observability also reduces MTTR by unpacking JavaScript stack traces, which allows you to easily narrow down the source of each error down to specific lines of code.
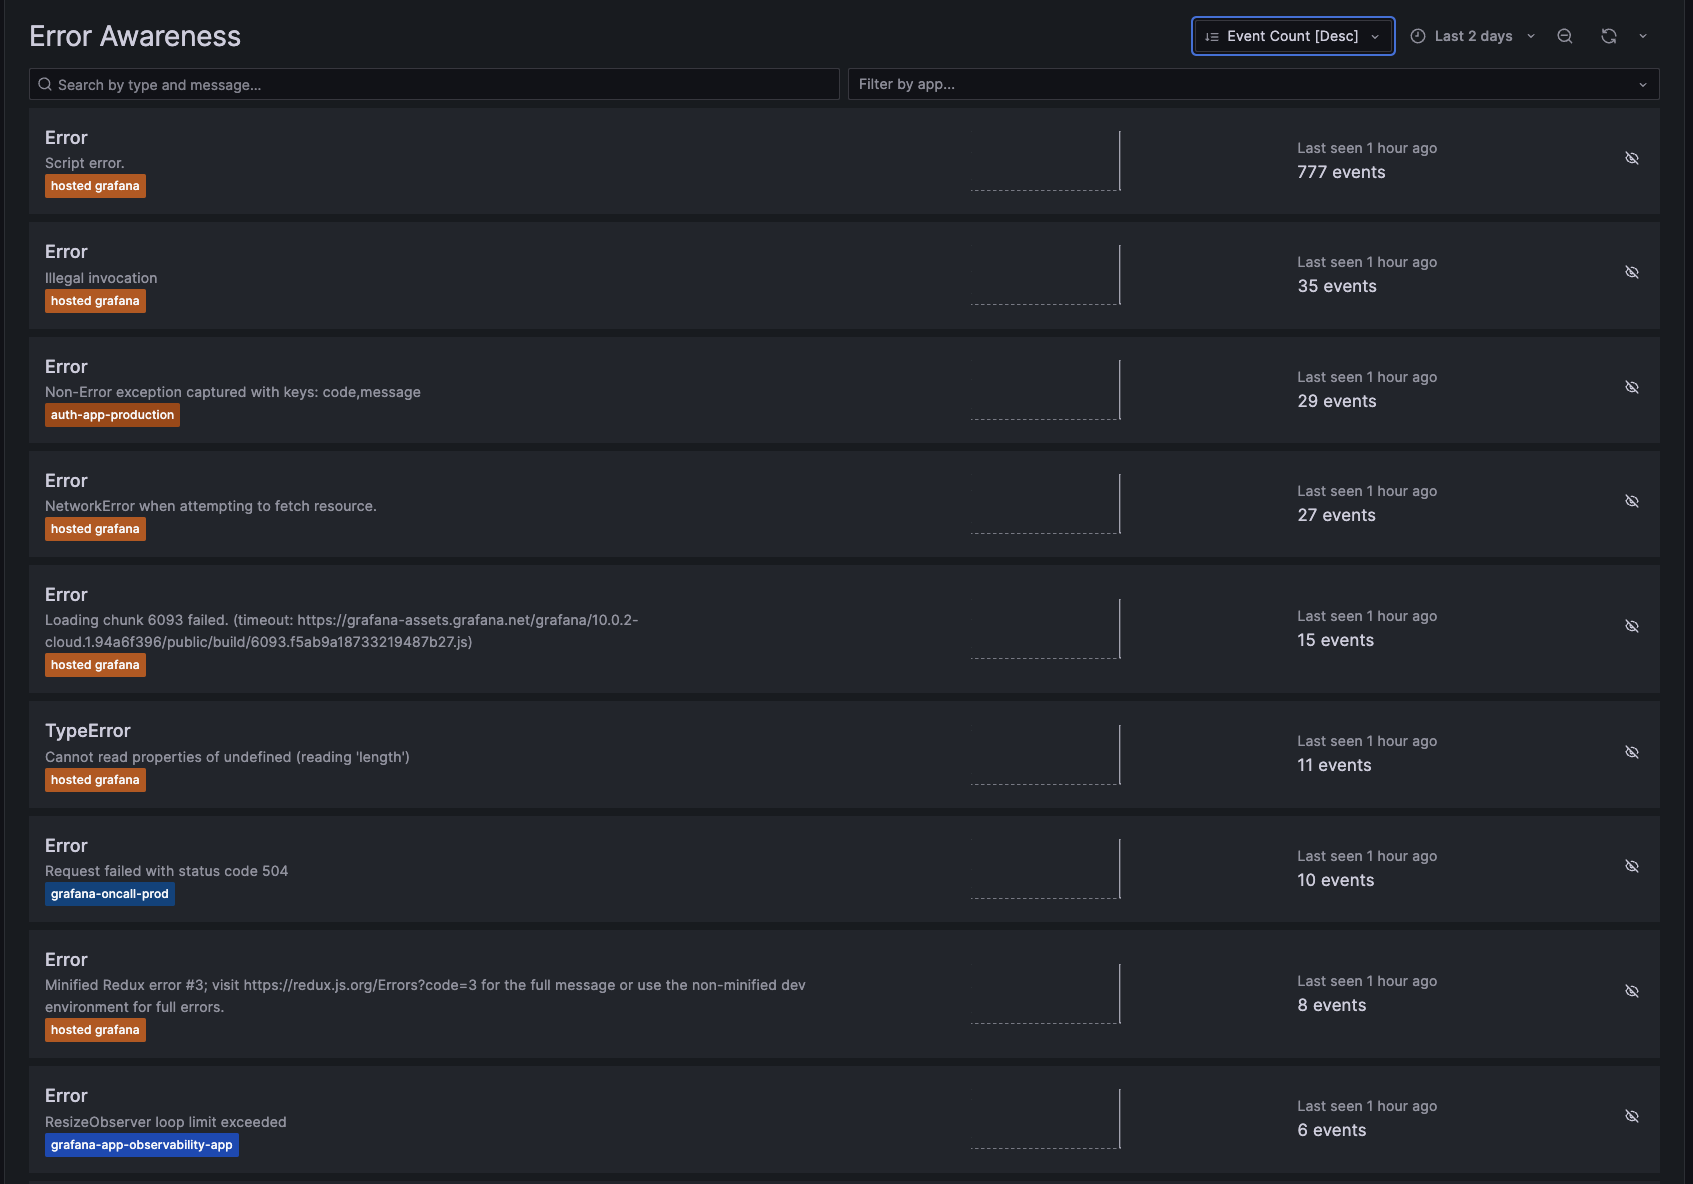
Grafana Cloud Frontend Observability automatically groups similar errors.
Troubleshoot Frontend Issues with End-to-End Visibility
When faced with a bug report, you want to know the specific circumstances and steps that caused the issue, which can be challenging or sometimes even impossible.
To investigate what went wrong with a user’s experience, Frontend Observability helps you find specific user sessions, which are the user journeys on your web application during a limited period of time. For example, a single session can contain multiple page views, third-party content requests, service requests, and user actions, such as clicks.
Frontend Observability can also track down user sessions based on parameters such as application name, browser type, and timeframe to reconstruct the specific timeline of events leading up to any issue. The user session is then correlated with backend requests in Grafana Cloud to provide rich context that will help expedite root cause analysis.
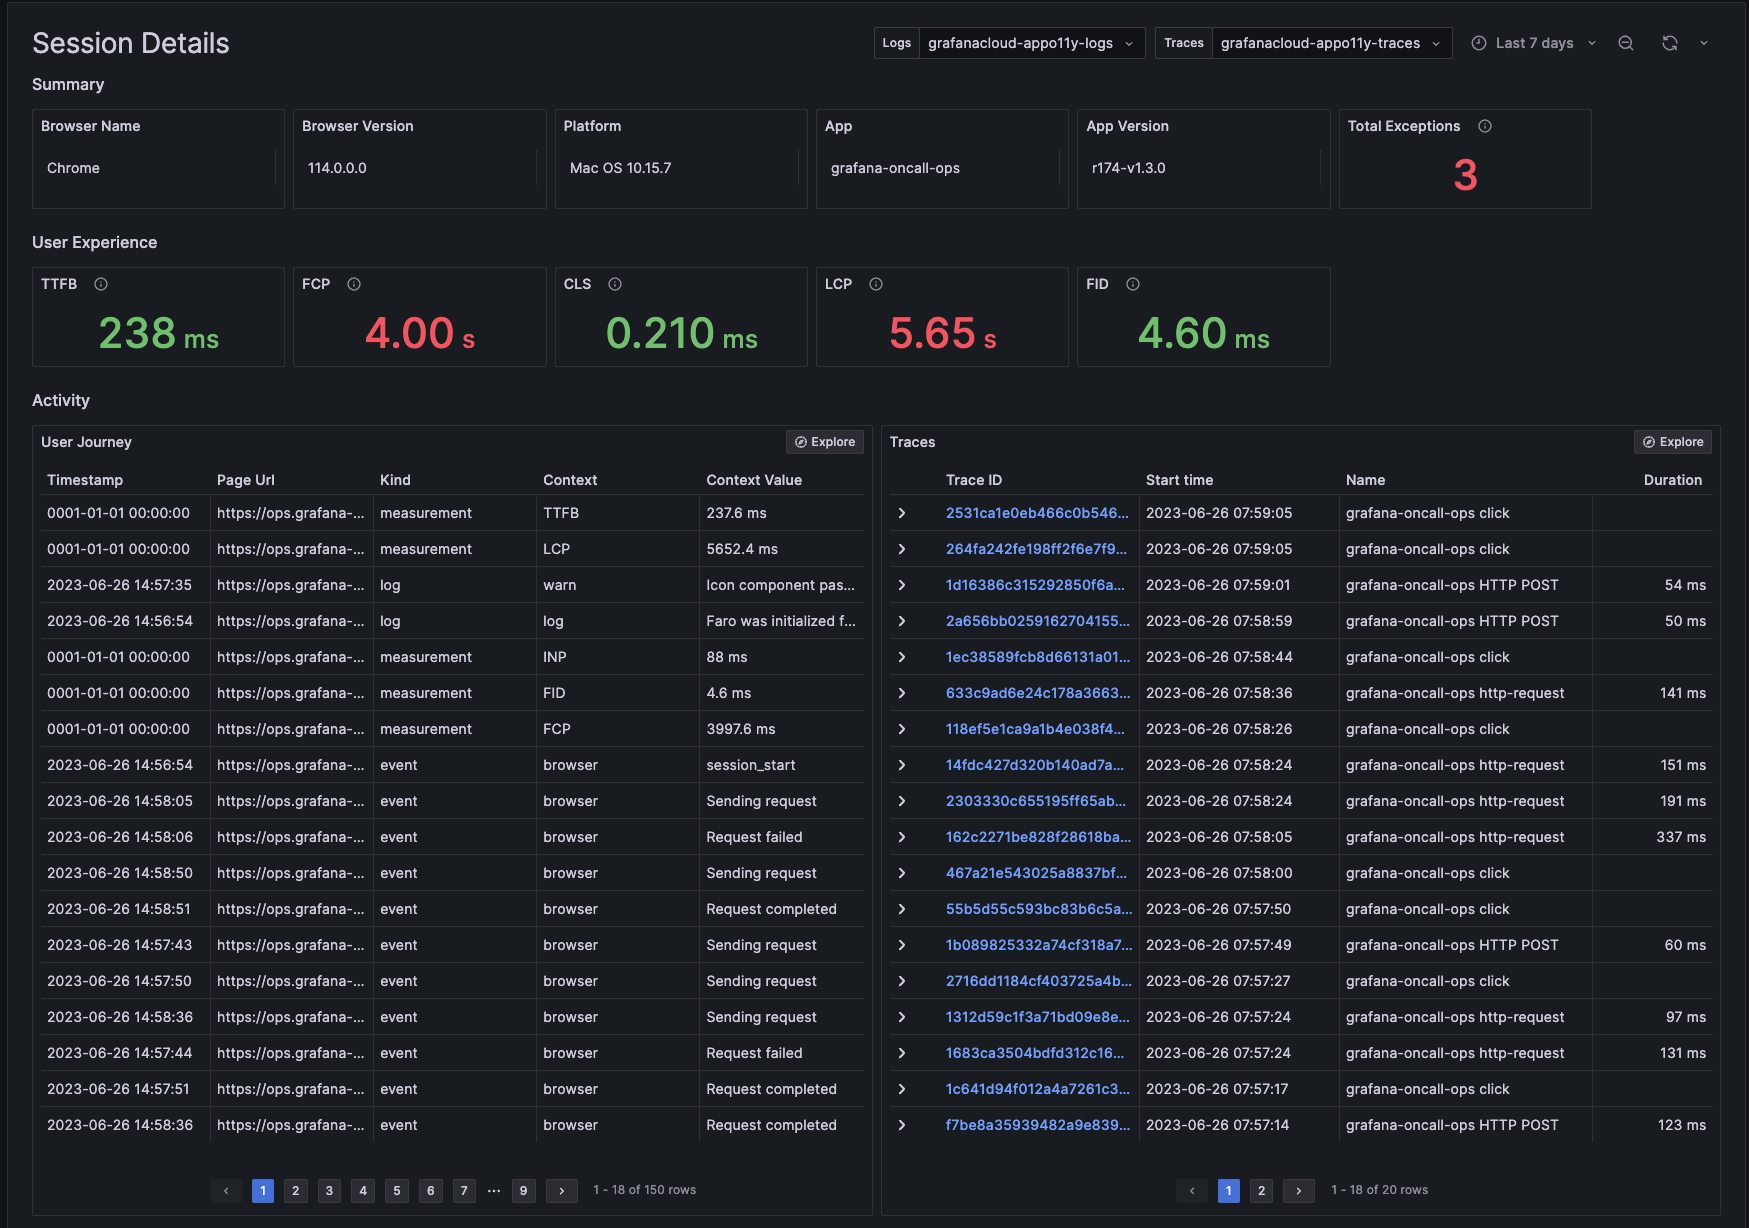
Grafana Cloud Frontend Observability tracks user journeys across the frontend and backend.
Query and Correlate Frontend Telemetry in Grafana
Different audiences may be interested in different views of frontend performance data. For example, an SRE may focus on whether a frontend application is meeting the SLA, while a product owner may want to know the impact of frontend performance on conversion rates or other business KPIs.
Frontend Observability data is stored in Grafana Cloud Logs, a highly scalable log monitoring solution that is powered by Grafana Loki and uses LogQL for queries. This gives you the flexibility to transform frontend performance data from logs to Prometheus-compatible metrics and create custom Grafana dashboards to share with your team and stakeholders. For example, you can correlate frontend performance data with application, business, and infrastructure performance data from multiple data sources to gain a single pane of glass view of how your software performance impacts business performance.
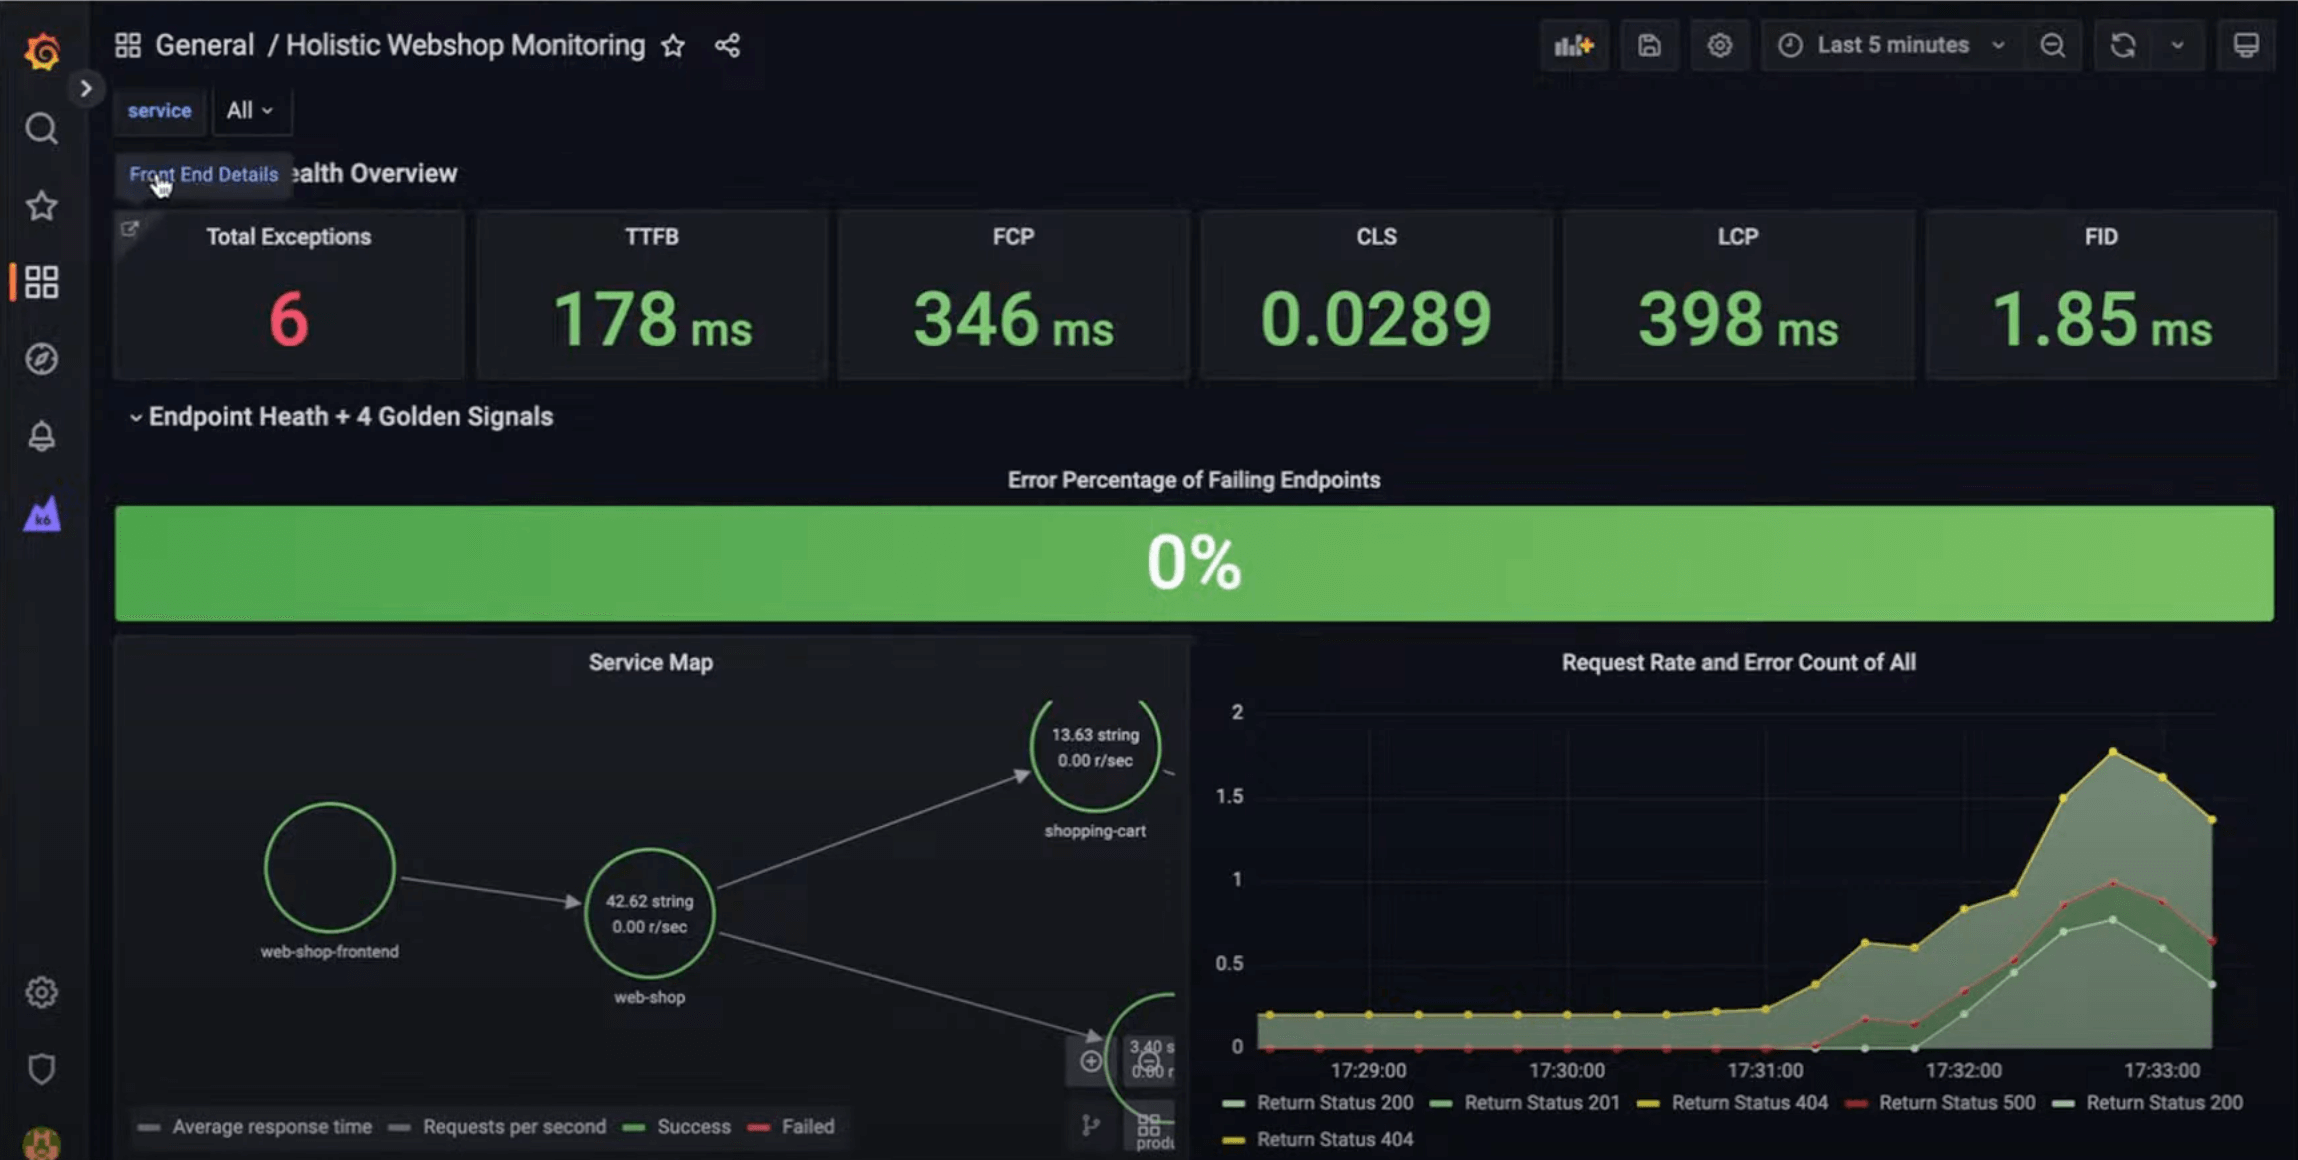
You can build any custom Grafana dashboard besides those served out of box by Frontend Observability.
How Real User Monitoring in Frontend Observability Works
Let’s imagine you are an ecommerce company that has just released a major update to your recommendations service in hopes of providing even better customer service. A few hours after the release, you get an alert that the Web Vitals for your site, First Contentful Paint (FCP) and Time to First Byte (TTFB), are outside of the recommended range.
On the overview page of Frontend Observability, you quickly notice that your FCP and TTFB are red. When you navigate to the errors section, you also notice a number of errors related to your list recommendations API. This helps you narrow down the problem domain to the recommendation service.
When you click to inspect an error, you see the corresponding metadata, including the user session ID. From there, you can quickly navigate over to the user session that corresponds with the error and get an idea of the user actions leading to the issue.
To find the root cause, you want to look at the end-to-end trace, which is easy to do within Grafana Cloud. Frontend Observability correlates the frontend user session with the request traces in a single view so you can easily navigate between them. By examining the longest trace and the spans related to the recommendation service, we see that the app.cache_hit attribute is set to false, and that the app.products.count value seems to be extremely high.
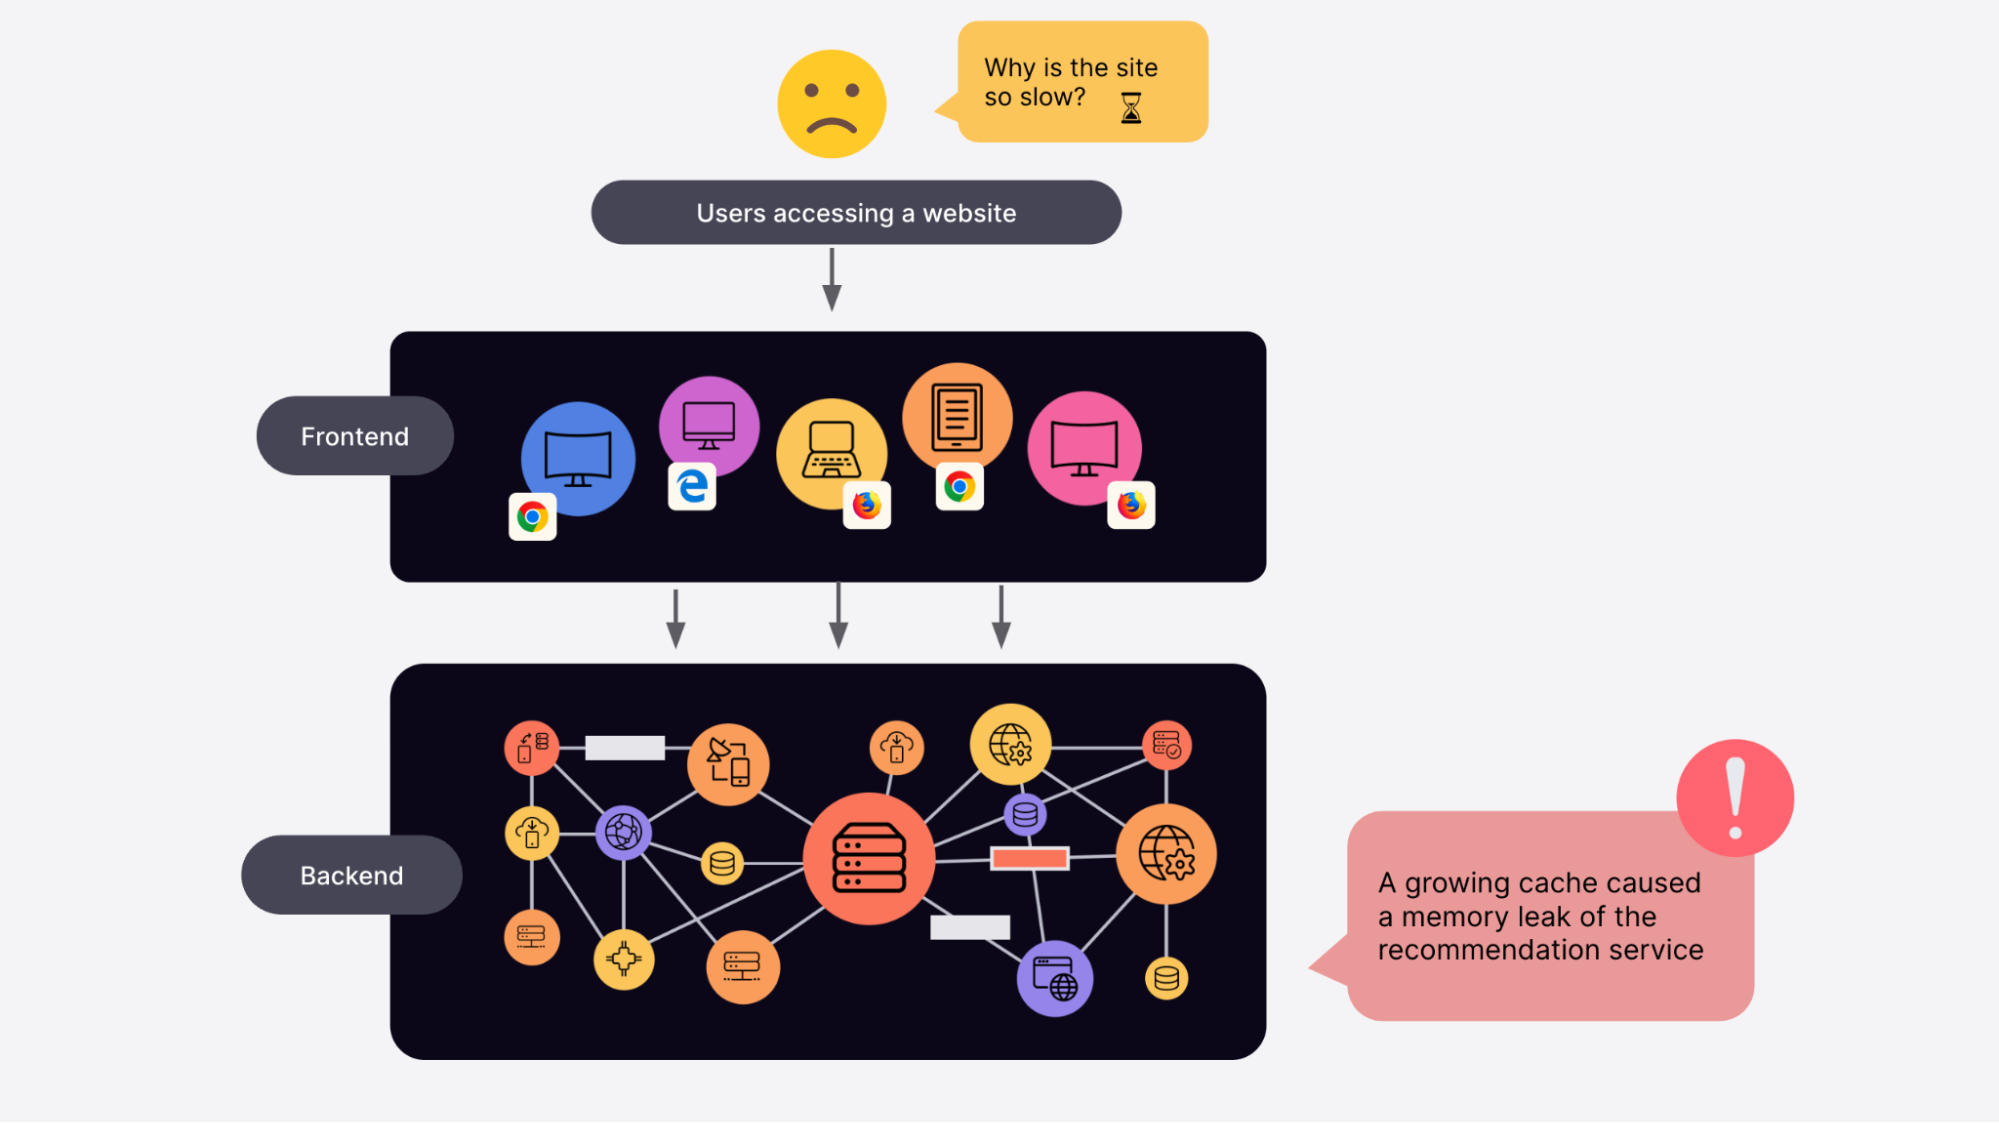
You then check a few more user sessions and notice that it seems to be some sort of issue hitting the cache for the recommendations engine. Now that you’ve narrowed down where the issue is coming from, you can easily switch over to the logs and/or metrics for the backend recommendations service and figure out why exactly so much latency is being introduced. In this scenario, it is being caused by a memory leak due to an exponentially growing cache.
This memory leak may have gone undetected for an indefinite amount of time because the factor that led to its discovery is the load time for the users. With Frontend Observability, we are able to not only understand what the user experience was from the frontend, but also seamlessly see what was happening on the backend so we could have a complete picture of what was going on end to end.
Frontend Observability helps you go from noticing a bad user experience to identifying the root cause in a few simple steps.
Get Started with Real User Monitoring with Frontend Observability
Frontend Observability is now generally available for all Grafana Cloud users, including those in our generous free-forever tier.
Pricing Overview
- Frontend Observability will be priced at $0.30 per 1k sessions with billing beginning on January 1, 2024.
- Customers can begin using Frontend Observability now and only pay for the logs and traces ingested into Grafana Cloud associated with such usage, based on regular Grafana Cloud pricing, until the sessions billing begins on January 1, 2024.
- Contact Grafana if you have any questions on pricing and billing for this offering.
About Grafana Labs
Grafana Labs provides an open and composable monitoring and observability stack built around Grafana, the leading open source technology for dashboards and visualization. There are more than 3,000 Grafana Labs customers, including Bloomberg, Citigroup, Dell Technologies, Salesforce, and TomTom, and more than 1M active instances of Grafana around the world. Grafana Labs helps companies manage their observability strategies with the LGTM Stack, which can be run fully managed with Grafana Cloud or self-managed with the Grafana Enterprise offerings, both featuring scalable metrics (Grafana Mimir), logs (Grafana Loki), and traces (Grafana Tempo) as well as extensive enterprise data source plugins, dashboard management, alerting, reporting, and security.
Source: Wei Li, Grafana Labs
Leading Solution Providers


Tabor Network
Sponsored Multimedia


Featured Events
-
AI & Big Data Expo North America 2024
 June 5 - June 6Santa Clara CA United States
 -
CDAO Canada Public Sector 2024
 June 18 - June 19
 -
AI Hardware & Edge AI Summit Europe
 June 18 - June 19London United Kingdom
 -
AI Hardware & Edge AI Summit 2024
 September 10 - September 12San Jose CA United States
 -
CDAO Government 2024
 September 18 - September 19Washington DC United States