

November 5, 2012
TIBCO Puts the Brakes on Excel
When tasked with writing up lab reports for their experiments, high school chemistry students may turn to Excel to represent and visualize their data. For some, it is an introduction to playing with data so that is visualized in an informative manner.
![]() On the other hand, for much larger experiments such as biopharmaceutical company Achaogen’s work in keeping antibiotics ahead of resistant pathogens, Excel is proving to be limited in its capabilities. Achaogen’s Rosemarie O’Shea, an informatics research scientist, spoke of the struggles of using Excel in a TIBCO Spotfire-produced whitepaper.
On the other hand, for much larger experiments such as biopharmaceutical company Achaogen’s work in keeping antibiotics ahead of resistant pathogens, Excel is proving to be limited in its capabilities. Achaogen’s Rosemarie O’Shea, an informatics research scientist, spoke of the struggles of using Excel in a TIBCO Spotfire-produced whitepaper.
According to O’Shea, it is significantly more difficult to garner insight out of Excel’s tables, which she calls unwieldy. Better visualization software can nudge the researcher toward a particular correlation. With Excel, it becomes necessary to pick out the correlations and mathematical representations on one’s own.
That Excel may be ill-equipped to handle the big data visualization needs of companies like Achaogen should not be a source of shame; Excel was not originally designed with those concepts in mind. Products like those from TIBCO trumpeted by the whitepaper are. To show an example, the image below represents a scatter plot of quite a few datasets collected by Achaogen.
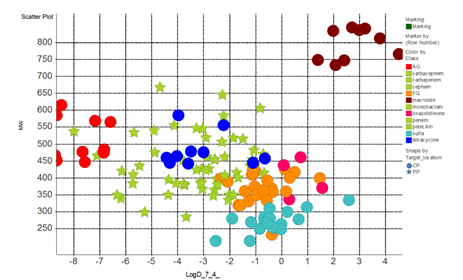
One thing is clear when looking at that picture: there are likely a lot of different datasets involved. Those different colored circles and stars all represent different chemical compounds. According to O’Shea, it is a hassle to place all this data in the same place in Excel. This could be visualizing the reaction rates of those compounds to different assays. Being able to see all of those in one place can provide insight not obvious at first glance. To that end, The 2-axis, 2-dimensional, one-graph format of Excel is quite limiting.
Another area in which Excel falls short is the ability to disregard obvious outliers or time intervals that researchers know mean little. “In Excel,” O’Shea said, “drilling down to the data you wanted to see wasn’t trivial and required the macro be run again with new data.” When it comes to large datasets, that process of re-processing the macro can require significant processing and time commitments.
To say that Excel is on its way out as a big data visualization tool would be unfair; it did not start out that way in the first place. That there exist tools like Spotfire’s which focus on that aspect of big data and outperform Excel should not be a surprise.
Related Articles
TIBCO Shines Light on Spotfire Concepts
TIBCO CTO Flashes R&D Future for Fast Data
Adding Autonomy to Personalized Medicine
Applications:
Visualization
Vendors:
TIBCO
Leading Solution Providers


Tabor Network
Sponsored Multimedia


Featured Events
-
AI & Big Data Expo North America 2024
 June 5 - June 6Santa Clara CA United States
 -
CDAO Canada Public Sector 2024
 June 18 - June 19
 -
AI Hardware & Edge AI Summit Europe
 June 18 - June 19London United Kingdom
 -
AI Hardware & Edge AI Summit 2024
 September 10 - September 12San Jose CA United States
 -
CDAO Government 2024
 September 18 - September 19Washington DC United States