TigerGraph Bolsters Database with Graph Analytics and ML

Companies that want to use powerful graph algorithms to explore hidden connections in their data may want to check out TigerGraph, which today unveiled a pair of cloud-based offerings designed to bolster graph analytics and machine learning use cases running within its cloud-based graph database.
The first new offering, dubbed TigerGraph Insights, is essentially a low-code, no-code BI and visualization tool for analyzing data sitting in the TigerGraph cloud database. It’s designed for use by analysts and non-technical employees who want to explore data and build interactive visualizations, such as dashboards, based on the connected data.
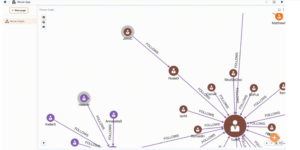
The big advantage of TigerGraph Insights is that it lets users go back and forth between traditional visualizations of data, such as standard tables, pie charts, line charts, and bar charts, and viewing the data in its native connected format. The BI vendors do not support connected graph views of data, says Jay Yu, vice president of product and innovation at TigerGraph.
“We actually we do provide connectors, so customers could use other BI tools like Tableau or PowerBI,” Yu tells Datanami. “But the problem with those tools is they translate from graph connective view back to the table views, back to relational, so that they can do the traditional BI. What we found missing was the integration with the graph view, the connected network graph view. So that’s why we are building this in, so people don’t have to connect the other tools.”
Keeping data closer to its native format allows TigerGraph Insights users to easily see patterns in the data that would otherwise be buried in a table full of numbers, or perhaps couldn’t even be visualized in a pie chart or a line chart. For example, the connectedness of suspect bank transactions in the graph view may indicate to the user the presence of a fraud ring, whereas the connectivity would be tough to describe in chart based on relational data.

TigerGraph Insights allows users to view data in its graph-connected state (Image courtesy TigerGraph)
TigerGraph Insights also supports the ability to overlap algorithms on top of the data to provide another layer of filtering and analysis. Clusters may be automatically differentiated in the graph through color coding, as Yu demonstrated to Datanami via Zoom yesterday.
“There’s also ‘find the shortest path between the two nodes’ and ‘all possible paths,’” Yu says. “Instead of seeing a bunch of numbers or a bunch of node names, you say, oh, that’s why these are shortest paths. So it’s more visual, more intuitive than the other tabular view.”
Users would typically not use TigerGraph Insights against massive data sets, such as those that are supported by TigerGraph. For that reason, the offering requires an analyst to filter out the data. The software provides a step-by-step method for doing that.
ML Workbench, meanwhile, is a Python-based framework designed to help data scientists develop machine learning applications. TigerGraph has offered a version of ML Workbench on prem, and this is the first time customers can run this in the cloud.
ML Workbench essentially provides the Jupyter data science notebook experience directly within the TigerGraph database. Plus, it’s loaded with 55 pre-built graph algorithms that have been adapted by TigerGraph specifically to work against its graph database for things like PageRank, clustering, and centrality.
Before launching ML Workbench, customers that wanted to train ML algorithms on TigerGraph data typically would extract the data and then use Apache Spark to train the models. Using TigerGraph to extract the features and train the models reduces the costs associated with the data movement and just makes for a simpler and more integrated experience, Yu says.
“The alternative is just Spark,” Yu says. “We say that since your data is already organized really well and connected in TigerGraph, we can push a lot of the graph-based machine learning inside, and give you enriched data in order to deepen your deep learning model building.”
This approach not only leverages the fact that the data is pre-sorted and pre-connected through the human-created graph database schema, but it also eliminates the need for additional high-level languages, since all operations can be specified through TigerGraph query language, GSQL.
“Other vendors have to rely on a combination and of graph query and procedural language like Java, JavaScript, or Python, in order to build those algorithms,” Yu says. “The benefit is because we have query optimization and we have distributed query processing, when you specify that, we automatically bring those execution down to our scalable engine, which is a distributed, parallel shared-nothing architecture.”
This delivers a greater degree of scalability than can be achieved by other mechanisms, Yu says. For example, Microsoft is using the TigerGraph database to power home-grown graph algorithms for an Xbox connected gamer community composed of 100 million individuals. Microsoft tried using other databases and couldn’t get it to work. Microsoft runs TigerGraph in an on-prem manner, but now this type of capability is available in the TigerGraph cloud with the click of a few buttons.
Over time, TigerGraph expects to expand its machine learning offering by including things like graph neural networks, or GNNs. Currently, ML Workbench can be used as part of the data pipeline that feeds feature into GNNs, but it cannot train GNNs, yet. That will probably change in the future, Yu says.
Demand for graph algorithms is high. TigerGraph has interest from major banks that want to explore the technology as they run into roadblocks using traditional deep learning methods, Yu says.
“There’s a lot of interest because people realize traditional machine learning hit a plateau because it’s black box,” Yu says. “We have a bunch of enterprises proving that using this graph-based machine learning approach, basically enriched with graph features, you’re able to uplift your model’s accuracy performance by 20%.”
TigerGraph Insights and ML Workbench are available now inside TigerGraph Cloud.
Related Items:
TigerGraph Releases New Benchmark Report
TigerGraph Bolsters Scalability with Graph Database Update
A Million Dollars Up for Grabs in TigerGraph Challenge
Editor’s note: This story has been corrected. Jay Yu’s name was misspelled. Datanami regrets the error.


