


October 10, 2022
Data Startup Count Raises $3M to Bring Analysts Closer to the Business

When it comes to driving better decision making and outcomes in business, data analytics teams can sometimes face challenges with existing data tools. The disjointed nature of analytics workloads, carried out with so many different tools, can create barriers between data analysts and the stakeholders they report to, which can lead to more work and less trust.
“The relationship between the data analyst and the people they serve, the stakeholders, that relationship is really difficult and broken,” says Ollie Hughes, co-founder and CEO of the London-based data startup Count. “We need to get data analysts closer to the business. We need to make them trusted advisors to the business, not just chart machines building dashboards all day long.”
Count recently announced it has raised $3 million in seed funding and has launched its flagship product the Canvas, a new collaborative platform that aims to reduce data analytics workloads by up to 75% and bridge the trust gap between analysts and stakeholders.
“Data analysts have surprisingly low job satisfaction compared to other roles, like data scientists or data engineers who have much higher job satisfaction. Part of that is because they never know what their work means, they are all constantly asked for new rework, they are always asked more questions, and they are not really involved in problem solving,” Hughes said in an interview with Datanami.
![]() In order to ease this disconnect, Count says the Canvas combines the best features of a digital whiteboard, a SQL integrated development environment, and a visualization tool to give users a single place for their entire analytics and problem solving workflow. The Canvas connects to any modern database and allows users to build pivot tables and visuals with no code required. Business teams can use the Canvas for requirements gathering, prototyping, analysis, business KPI reviews, customer flows, ad hoc reports, and customized dashboards. According to the company, customers can generate any data report they need, from notebooks to dashboards, and deep dive into data using cells to link queries together and share the logic behind them.
In order to ease this disconnect, Count says the Canvas combines the best features of a digital whiteboard, a SQL integrated development environment, and a visualization tool to give users a single place for their entire analytics and problem solving workflow. The Canvas connects to any modern database and allows users to build pivot tables and visuals with no code required. Business teams can use the Canvas for requirements gathering, prototyping, analysis, business KPI reviews, customer flows, ad hoc reports, and customized dashboards. According to the company, customers can generate any data report they need, from notebooks to dashboards, and deep dive into data using cells to link queries together and share the logic behind them.
Count was founded by Hughes and co-founder Oli Pike after they met at the University of Cambridge and later began careers as management consultants in London. While consulting for large companies, Hughes used various dashboarding tools like Tableau, Power BI, or Qlik, but found them lacking when it comes to collaboration and presentation capabilities.
“It got to the point where Oli and I were talking about how these tools are all the same, they just have different flavors,” Hughes said. “Tableau is good for visualization, Qlik is good for data modeling, but when it comes to presenting facts and figures to your stakeholders and your audience, and trying to drive outcomes from that, they all have the same interface. They’re just a dashboard of numbers that are read-only and are all the same when it comes to delivery of insight.”
While working collaboratively with clients, Hughes came to resent these static dashboards: “The dashboard is published, and it’s very read-only, and you’re not really getting to the meat of the problem. We’re not actually discussing numbers, wrestling with them, and dynamically making decisions. It feels very wooden,” Hughes said. “So, we set out to try and find a different way of tackling the problem.”
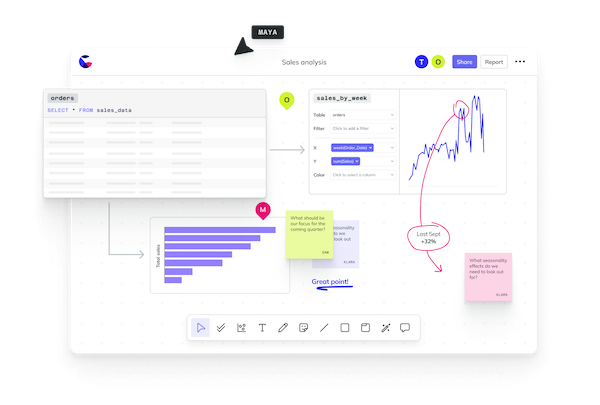
An example screen from the Canvas shows its collaborative features. Source: Count
When conceptualizing a better way, Hughes and Pike decided to look at the actual decision-making process: “Let’s not look at how the tool works, let’s look at how the people work. Let’s look at how people make decisions, how they discuss them, and how they gain confidence in a decision to make a change,” said Hughes.
After conducting market research interviews with companies large and small, including startups and enterprises, Hughes and his team found that arriving at a single business decision can be difficult and time consuming: “Doing data analysis, finding out new information, making a decision or strategic change involves a huge amount of iteration.” These decisions often involve a back-and-forth conversation involving multiple people, requiring consensus building and collaboration, something the existing tools cannot always facilitate. While these first-generation dashboard tools have been successful in getting data out of the database into a visual form, Hughes says “the next generation has to be about making the numbers useful and making them drive better decisions.”
The Canvas captures each element of the analytics workflow in one place: gathering requirements, exploring the data, analyzing the results, adding narratives and presenting findings. Hughes says the product’s collaborative nature supercharges the analytics workflow: “The real goal is to reduce the friction of communication with stakeholders and make reports much more contextualized, clearer, and more trusted,” Hughes says. “Rather than being a dashboard, [the Canvas] is one big white space where you can put in SQL queries or write create visuals, put in post it notes, ask questions, and it’s all real time so you can do this as a team.”
Count’s total funding is now at $5.2 million after its most recent $3 million seed round, led by TheVentureCity alongside existing investors LocalGlobe and angels DJ Patil and Anthony Goldbloom.

Count Co-Founders, Ollie Hughes and Oli Pike.
Early adopters of Count’s platform have enjoyed its capacity for streamlining complex processes, with some reporting up to a 75% decrease in workloads. In interviews with Canvas users, Hughes asked analysts to name the best part of using the platform and was repeatedly told about how much time it saves: “People have said, ‘Something that would normally take me four days of meetings, I’m doing it in an hour.’”
“Count is by far the best data tool I’ve ever used,” says Christopher Mee, marketing analytics manager at Hyperscience. “It’s given our marketing team a shared space where we can explore data together and reach conclusions everyone understands and trusts.”
“The development cycle in similar tools, such as Tableau, is challenging,” says Madhav Goswami, principal analytics engineer at Farimoney.io, an early adopter. “You’ll get good dashboards but to get good context, to tell good stories, you need to devote too many resources. The Count canvas allows you to think multi-dimensionally in a way you can’t in Tableau.”
Related Items:
Big Data Study Cites Challenges, Predicts Growth
Boosting Productivity and Achieving Business Visibility Through Data Democracy
BI Tools — Are They Enough to Build a Data-Driven Culture?
Vendors:
Count
Leading Solution Providers


