


January 20, 2022
Companies Drowning in Observability Data, Dynatrace Says

(Andrea Danti/Shutterstock)
If you’re finding it difficult to manage a sprawling infrastructure spanning multiple clouds running constantly changing containerized workloads, you’re not alone. According to a study released this week by Dynatrace, more than half of organizations’ DevSecOps teams are feeling the pain when it comes to observability data.
The rise of multi-cloud and hybrid computing setups gives organizations the flexibility to run applications where they fit best. And with Kubernetes managing the containers, it’s possible to scale up quickly to match computing capacity to demand, and then shrink it back down just as quickly.
All this dynamism is exactly what we’ve asked for, but it turns out it comes with a cost. According to Dynatrace, one of those costs is an increasingly disparate observability system that forces organizations to use manual methods to monitor individual stacks.

The average company uses seven different infrastructure monitoring tools to manage multi-cloud environments, Dynatrace found (Image source: Dynatrace)
The survey found 58% of IT leaders say infrastructure management increasingly is a drain on resources, and that support teams are forced to constantly switch between different solutions and dashboards to figure out what’s going on, according to Dynatrace’s survey of more than 1,300 CIOs and other senior IT practitioners. It also found 61% say observability “blind spots” in their multi-cloud environments are becoming a greater risk to digital transformation as teams find themselves without an easy way to monitor their infrastructure end-to-end.
“Multi-cloud strategies have led to a surge in complexity, with infrastructure teams drowning in data as they try to monitor and manage their constantly changing environments,” Dynatrace says of its report, titled “The move to multi-cloud environments has broken traditional approaches to infrastructure monitoring.”
The average organizations has five cloud environments and seven different infrastructure monitoring solutions, Dynatrace says, adding that 57% of survey respondents say this makes it difficult to optimize infrastructure performance and resource consumption.
“Multi-cloud strategies have become critical to keeping up with the rapidly accelerating pace of digital transformation, but teams are struggling to manage the complexity that these environments bring,” Dynatrace founder and CTO Bernd Greifeneder says in a press release. “Dependencies are growing at an exponential pace, driven by faster deployment frequency and cloud-native architectures that bring constant change.”
The situation is made even more complex by open source technologies that generate even more data, Greifeneder says. What’s more, each cloud service or platform has its own monitoring solution. Many infrastructure teams are stitching together data and tools to get see what’s happening across multiple clouds and hybrid or on-prem systems.
“To build a complete picture, teams are forced to manually extract insights from each solution and then piece these together with data from other dashboards,” he continues. “Organizations must find a way to help these teams reduce the time they spend on manual tasks and refocus on strategic work that delivers new, high-quality services for customers.”
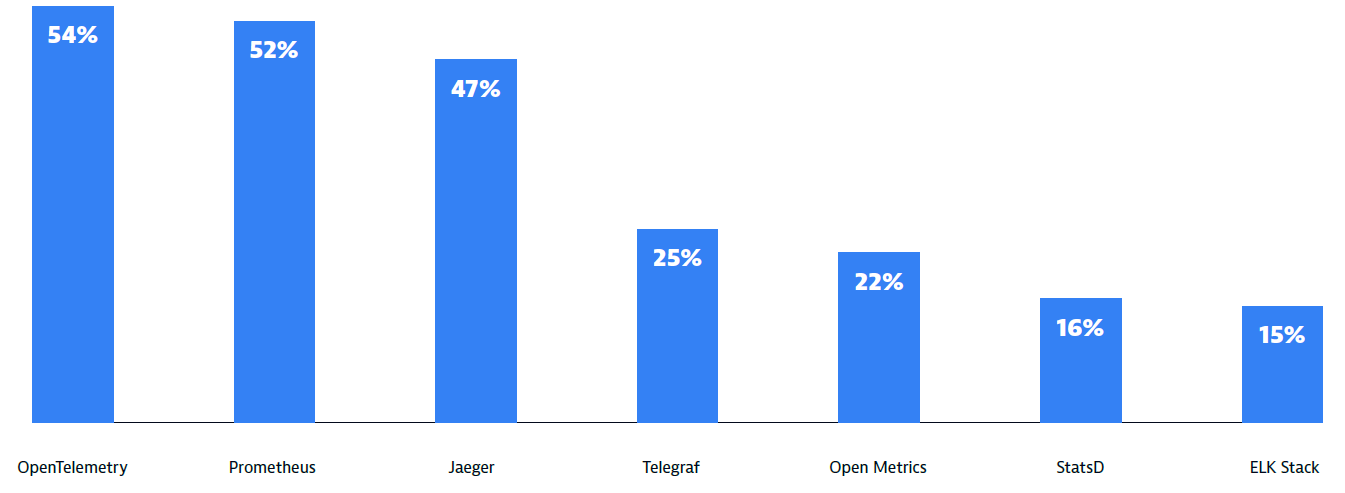
The observability solutions that IT leaders plan to adopt (Image source: Dynatrace survey)
One potential solution to this mess is a solution built upon open observability technology, which 100% of survey respondents say they plan to implement within the next two years. Dynatrace, meanwhile, recommends a “unified observability” system that delivers end-to-end insights.
The survey found that OpenTelemetry was the most popular observability standard, with 54% of users reporting use of this technology, followed by Prometheus (52%) and Jaeger (47%). Telegraf, Open Metrics, StatsD, and the ELK stack followed with adoption rates in the teens and the twenties.
Dynatrace is one of many AIOps vendors that has adopted OpenTelemetry, which defines a standard for how logs, traces, and metric data should be extracted from the servers, infrastructure, and applications that companies need to monitor. Prometheus, meanwhile, is a time-series metrics monitoring tool, while Jaeger provides distributed tracing for microservices architectures.
Related Items:
OpenTelemetry Gains Momentum as Observability Standard
Who’s Winning In the $17B AIOps and Observability Market
The True Cost of IT Ops, The Added Value of AIOps
Applications:
Data Mining
Vendors:
Dynatrace
Leading Solution Providers


