


August 17, 2020
Grafana Labs Visualizes Growth with $50M Round

(Griboedov/Shutterstock)
Grafana Labs, developer of a popular open source tool for visualizing logs and metrics, today announced that it’s raised $50 million in a Series B round of investment. The company’s CEO, Raj Dutt, tells Datanami the money will go primarily to engineering, with a focus on expanding Grafana’s role as an “open and composable observability stack.”
Grafana was created in 2014 by Torkel Ödegaard, a developer at the online travel company Orbitz. It was originally designed to be a front-end for Graphite, which another Orbitz developer created years earlier for capturing and storing time-series data generated by its sprawling IT setup.
Sensing a greater opportunity around Grafana, Ödegaard teamed with Dutt and Anthony Woods to co-found Grafana Labs (then called raintank) in 2014. Graphite was the first data source fueling Grafana dashboards, but the open source community has added more than 30 more over the years, with the latest being New Relic, which was just announced last week.
The openness of Grafana and the freedom it gives users to compose their own dashboards from a wide mix of open and proprietary data sources appears to be driving considerable growth. The number of organizations using Grafana has roughly doubled in the past year, to around 550,000, according to Grafana Labs. (Downloads of Grafana number in the tens of millions, but that’s a poor metric for tracking actual use, Dutt says.)
“We really prioritize interoperability and openness,” Dutt says. “Since we were founded around this open source project, that’s been our M.O.”
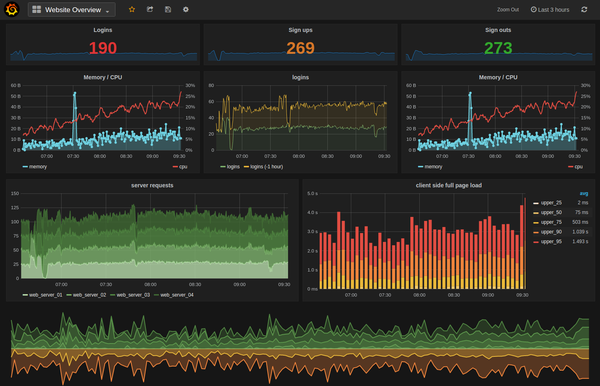
Grafana is used to build custom dashboards that SREs and DevOps professionals use to monitor infrastructure
Grafana Labs is focused on developing the best dashboarding tool for viewing what Dutt dubs the “trinity” of observability data: metrics, logs, and traces (the company started with metrics, but has added support for logs and traces in the past year).
That sometimes puts Grafana in competition with other commercial and open source platforms used by DevOps teams and site reliability engineers (SREs) to monitor increasingly complex and fragmented infrastructure. But Dutt doesn’t seem to mind.
“We have this big-tent philosophy,” Dutt says. “It’s all about interoperability. We don’t view Elastic as a competitor. We view them as a really good database that some of our customers want to use. I’m biased when I say this, but we think Grafana is the best virtualization software, and that’s why people use it with Elastic instead of Kibana.”
Kibana is supposed to be the front-end for visualizing log data in Elastic, but Kibana only work with Elastic. So what happens when you want to use Kibana to visualize data that lives outside of Elastic, which is based upon a Lucene data store and search engine? “You can’t, unless you put it inside Elastic, so you’re back to this whole interoperability with multiple data sources.”
The same goes for Splunk, which Dutt says is a great tool for collecting and visualizing log data. However, Splunk requires you to store the data it its NoSQL database, so it can’t be used for viewing log data that’s being stored elsewhere.
“People want to do logs in Splunk, maybe do metrics in Prometheus, and traces in Jaeger,” Dutt says. “So [Grafana] gives customer choice, and it’s quite a unique approach. Most vendors want to lock their customer into the platform.”![]()
A similar story is playing out in the clouds. Amazon Web Services, Google Cloud, and Microsoft Azure each offer tools that customers can use to monitor their cloud infrastructure. But for obvious reasons, customers can’t monitor their EC2 activity from Google Cloud Monitor, and Azure Monitor is not going to give customers insight into their Google Cloud infrastructure. That’s why the cloud vendors are eager to work with Grafana, which the cloud customers are demanding that the cloud vendors support.
The rising popularity of hybrid cloud deployments puts Grafana right where it wants to be: Playing the role of Switzerland for visualizing logs, metrics, and traces. “Hybrid is our sweet spot,” Dutt says. “Since we connect to so many different databases, it’s really easy to build a complete picture, whether you’re a cloud native or a server hugger.”
Grafana Labs raised $24 million in its Series A round, which it announced in October. Much of that money went to creating and building out the company’s sales and marketing organization, which was practically non-existent before Lightspeed Venture Partner and Lead Edge Capital stepped in.
The company generates revenue from Grafana Cloud, which is a hosted version of Grafana that supports Prometheus (an open source event monitoring database) and Loki (an open source logging solution developed by Grafana Labs). It also sells Grafana Enterprise, which is used by organization’s monitoring on-prem infrastructure, and also offers plug-ins to proprietary data sources like New Relic, Splunk, and Datadog. All told, Grafana has 1,000 paying customers, including companies like Bloomberg, Uber, and The Trade Desk, which operates a real-time bidding system so big and complex that it broke Rackscale’s cloud twice.

Raj Dutt is the CEO and co-founder of Grafana Labs
“Ninety percent of our users will never pay us, and that’s by design. It’s really important for us to have a healthy open source community. That’s mission number one,” Dutt says. “As far as use of [the $50 million Series B] funds go, we’re really going to accelerate our product roadmap and bring forward a lot of our plans and ideas for this open and composable observability stack.”
Some of the money will go to launch the Grafana Accelerator Program, which will be used to host and promote new use cases for Grafana. Dutt says that 80% of Grafana users are SREs and DevOps professaionals who use it to monitor the usual suspects: Kubernetes clusters, Internet infrastructure, etc.
“But 20% use it for other things, like senor data, industrial Internet of Things, business intelligence,” Dutt says. “There are some ERs in Tokyo using it monitor wait times in different ERs across the city. SpaceX is using it. It’s really interesting to see what the community, which we’re lucky enough to be at the center of mass of, kind of gets up to.”
Grafana Labs is currently working on building out its support for traces. Grafana 7, which was released earlier this year, supports traces, but doesn’t include its own backend for analyzing them. The company is also working on bolstering support for synthetic monitoring, and is also doing some work to incorporate advanced statistical analysis and machine learning into the platform to assist with the identification of trends and anomalies.
“I’ll avoid using the word AI, otherwise we have to take a shot of vodka,” he says. “Too much hype.”
Related Items:
Grafana Labs Announces General Availability of Grafana 7.0
Cortex, a Prometheus Spinoff, Boosts Data Monitoring
Rethinking Architecture at Massive Scale
Applications:
Enterprise Analytics
Vendors:
Amazon Web Services, Elastic, Google Cloud, Grafana Labs, Microsoft Azure, New Relic, Orbitz, Splunk
Leading Solution Providers


