Localized Models Give Hospitals Flexibility in COVID-19 Response

(hxdbzxy/Shutterstock)
Hospitals have been re-allocating resources and delaying elective surgeries in anticipation of a surge in COVID-19 patients over the past month. That surge didn’t materialize in most locations, and now, as the number of COVID-19 patients nationally begins to peak, hospitals are turning to advanced analytics to help them model their re-opening.
Change Healthcare develops one of the analytics tools that hospitals are leaning heavily upon to chart a course through the COVID-19 pandemic. The company’s offering, dubbed the Intelligent Healthcare Platform, gives hospitals a centralized place to visualize a range of data types and to model various scenarios impacting clinical, financial, and operational aspects of healthcare organizations.
For the past month, Change Healthcare’s platform has been the go-to source for healthcare decision-makers to view the latest data and model near-term scenarios as the coronavirus pandemic plays out. Thousands of healthcare providers use the product, which is based on TIBCO’s Spotfire analytics tool.
“Executive leadership teams who weren’t really interested in analytics or machine learning or AI or that sort of thing all of a sudden wanted to look at our dashboard multiple times per day,” says TIBCO Chief Analytics Officer Michael O’Connell. “It’s been kind of amazing.”
In the early days of the pandemic, the BI platform played an important role in helping hospitals assess their inventory of ventilators, ICU beds, and other critical resources needed in the battle of COVID-19, says Denise Johnson, a product manager with Change Healthcare.
“We spent the early parts of March really focused on what patients we have in the hospital, in critical care,” Johnson tells Datanami. “Generally these are multi-hospital health systems, and they’re trying to get a handle on overall basic census occupancy [and answering questions like] Do I have the supplies I need? What is the current run-rate for key supplies? What is the status on backorder or reorder?
“Spotfire in essence has become this mezzanine manger that helps the organization understand what’s happening operationally and where specifically they’re going to have problems, whether it’s a given hospital, a given critical care area, etc.”
Hospital customers used the modeling capability of Spotfire to predict consumption of key resources and supplies. They are provided templates that allow them to model the number and type of patients they can expect to handle. The templates are pre-populated with data gathered from national surveillance campaigns run by the Center for Disease Control and Prevention (CDC).
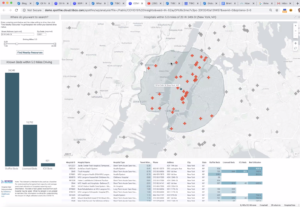
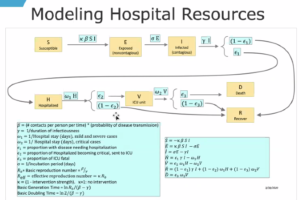
The modeling function is geolocation-driven, says TIBCO’s O’Connell. “You can highlight certain counties around your hospital, bring in census data to look at age distribution of the region. It then brings in CDC data on infection and hospital rates as a function of that. And underneath that is a target model for tracking progression, from exposure to infection to hospitalization to ICU to recovery.”
By default, the models are pre-configured with variables provided by the American Hospital Association (AHA) for parameters like severity, age of patients, and length of stay. There is even a setting for the reproduction number for COVID-19, or the R0 figure. Spotfire allows the hospitals to tweak the settings based on what they’re seeing at their local level.
While many areas of the country have been successful in “bending the curve,” it has resulted in an under-utilization of hospitals in those areas. That capability to tweak the forecast models allowed hospitals to better respond to these events as they unfolded, Change Healthcare’s Johnson says.
“The hospitalization rate as originally expected, and then actually what we’re seeing are much lower in cases per 100,000 than what we first thought,” Johnson says. “We really didn’t want to overpredict what was happening operationally. In some areas, social distancing and other interventions have created less of an outbreak situation.”
For example, the initial estimates for hospital length-of-stay from the AHA was eight days for non-critical COVID-19 cases and 16 days for critical cases. Data collected from Change Healthcare indicate the average length of stay is about five to six days for critical cases, Johnson says.
That’s why is so important for a hospital to be able to change their models as the facts on the ground change. “We took an approach to parameterize a lot of model variables, thus enabling a local view of what’s really going to happen in my geographic area over the next 30 days,” Johnson says. “What’s happening in Chicago is a lot of different than what’s happening downstate in rural Illinois.”
The lack of sufficient surveillance data – i.e. a lack of COVID-19 testing – is a key factor in the original forecasts being wrong, says Tina Foster, Change Healthcare’s vice president of advisory and analytics visualization service.
“What we’re discovering is that much of the data and the models are flawed simply because we don’t have that national surveillance to really get accurate information on who has the disease, who’s non-symptomatic, and looking at the denominator, which really drives the confidence of the models,” she says. “So we have been trying to adjust those parameter and normalize it to the degree possible with human inputs in the local market.”
This is a very different type of disease modeling than what’s done at the University of Washington’s Institute for Health Metrics and Evaluation (IHME) or Imperial College London, two sources of widely cited population-level forecasts for the COVID-19 pandemic.
“They’re very broad brush strokes. We’ve been more of a ground-up rather than a top-down approach,” O’Connell says. “Change has access to detailed data from their patients who are in the hospital setting, and so do their hospital customers. So we’re able to look at these coding groups from claims data that are actual patients in a local region.”
As the crest of the first COVID-19 wave passes, hospitals will be looking to get back to a normal footing. The modeling capability of the TIBCO/Change Healthcare analytic tool can help them navigate that process in a healthy and profitable manner, Johnson says.
“Right now is we have a pretty good understanding of what your baseline looked like. We have a pretty good understanding of what happend during the last four weeks. But what is going to happen over the next four, eight, 12, weeks and how do we actively manage the recovery period, volume, and financials.”
The biggest uncertainty now is how quickly the hospital volume will pick up due to people who have delayed elective procedures. For less-critical procedures, people may be fearful over possibly contracting COVID-19, which could hold them back.
“I’m very much now working with customers around modeling the recovery period, operationally how are we going to work those backlogs down, what’s the most cost-effective way to do that and do that in a way that we can return our hospital operations to profitable as soon as feasible and also as soon as it’s safe,” Johnson says. “What the recovery looks like is a little different [from the emergency modeling] because we have to guess a little bit how quickly patients are going to be comfortable coming back to the emergency department and when we are going to get those real trauma things back.”
Related Items:
New COVID-19 Model Shows Peak Scenarios for Your State


