


May 24, 2017
Pepperdata Takes On Spark Performance Challenges
Apache Spark has revolutionized how big data applications are developed and executed since it emerged several years ago. But troubleshooting slow Spark jobs on Hadoop clusters is not an easy task. In fact, it may even be harder than MapReduce. But now the performance gurus at Pepperdata think they have a solution.
As a data processing engine for Hadoop, Spark is orders of magnitude faster than MapReduce. It’s also easier to code than MapReduce, and more flexible too. It’s better in almost every respect, except perhaps one: code visibility. And while nobody is giving up on Spark, it’s an area that deserves some attention.
“One of the challenges that developers have with Spark is that it hides things from them,” Pepperdata co-founder Chad Carson tells Datanami. “Unlike MapReduce, which required people to think really hard about how the cluster was processing and how the cluster was operating in order to solve their problem, Spark really abstracts a lot of that away, so developers can think just about what they want to have happen, and then Spark takes care of it.
“That opens up a wider set of people to program in Spark and they can do things much faster<” Carson continued. “They can write applications much faster. But the flip side of that is because it’s hiding execution details, it’s really hard for developers to connect their code to the actual hardware usage.”
Pepperdata yesterday unveiled Code Analyzer for Apache Spark, a new tool that allows administrator and developers to track down the source of performance glitches in Spark apps, and get them back up and running at full speed.

Code Analyzer for Apache Spark provides a detailed time-series of performance data for Spark apps
The software provides detailed resource usage and performance information about Spark applications, as well as line-by-line code analysis for all Spar-on-YARN applications developed in Scala, Java, Python, R, and any other languages supported by Spark.
Specifically, the product deploys agents to Hadoop to track how much CPU and memory the individual Spark programs are consuming on the cluster on a second-by-second basis. It also tracks garbage collection and HDFS reads, which can also impact performance.
While the Spark creators at Databricks are working to improve Spark’s efficiency by improving things like Spark’s Java runtime and its use of garbage collection, there will always be a need for Spark developers to optimize their apps, Carson says.
“There’s only so much the framework can automatically take care of,” he says. “You still want your developer to know, if you have a problem with your app, what’s causing it and what’s going on with the hardware.”
The new tool can also inform developers and administrators if bad “cluster weather” – or the minute-to-minute state of a busy multi-tenant cluster – is to blame for poor performance. “No matter how fast something is, if your Spark application is holding onto a lot of memory on the cluster, that can be stopping other people from getting their work done,” Carson says.
Code Analyzer can tell a developer which stages of the application are causing a bottleneck, and even which lines of code are associated with the slowdown. But ultimately it’s up to the developer to fix things. The fix could come in the form of re-ordering how some data processing tasks are performed, or maybe changing the level of parallelism in the application.
“It’s really pointing out to the developer where the problem is in the code,” Carson says. “That’s usually enough. And it’s often pretty obvious what to change, once they know where to look. Showing them where to look is really the key thing for Code Analyzer here.”
While Spark is much faster than MapReduce at many Hadoop tasks, it’s fairly common to run into under-performing Spark applications. That could be because the developer was in a rush to put a big data app into production, and forgot to come back to optimize it.
“As fast as Spark is, they’re slower than you’d expect,” Carson says. “It’s really easy to write Spark applications, but it’s also easy to write them inefficiently. This is really critical with Spark [in that they often] use a lot more memory than they need to use.”
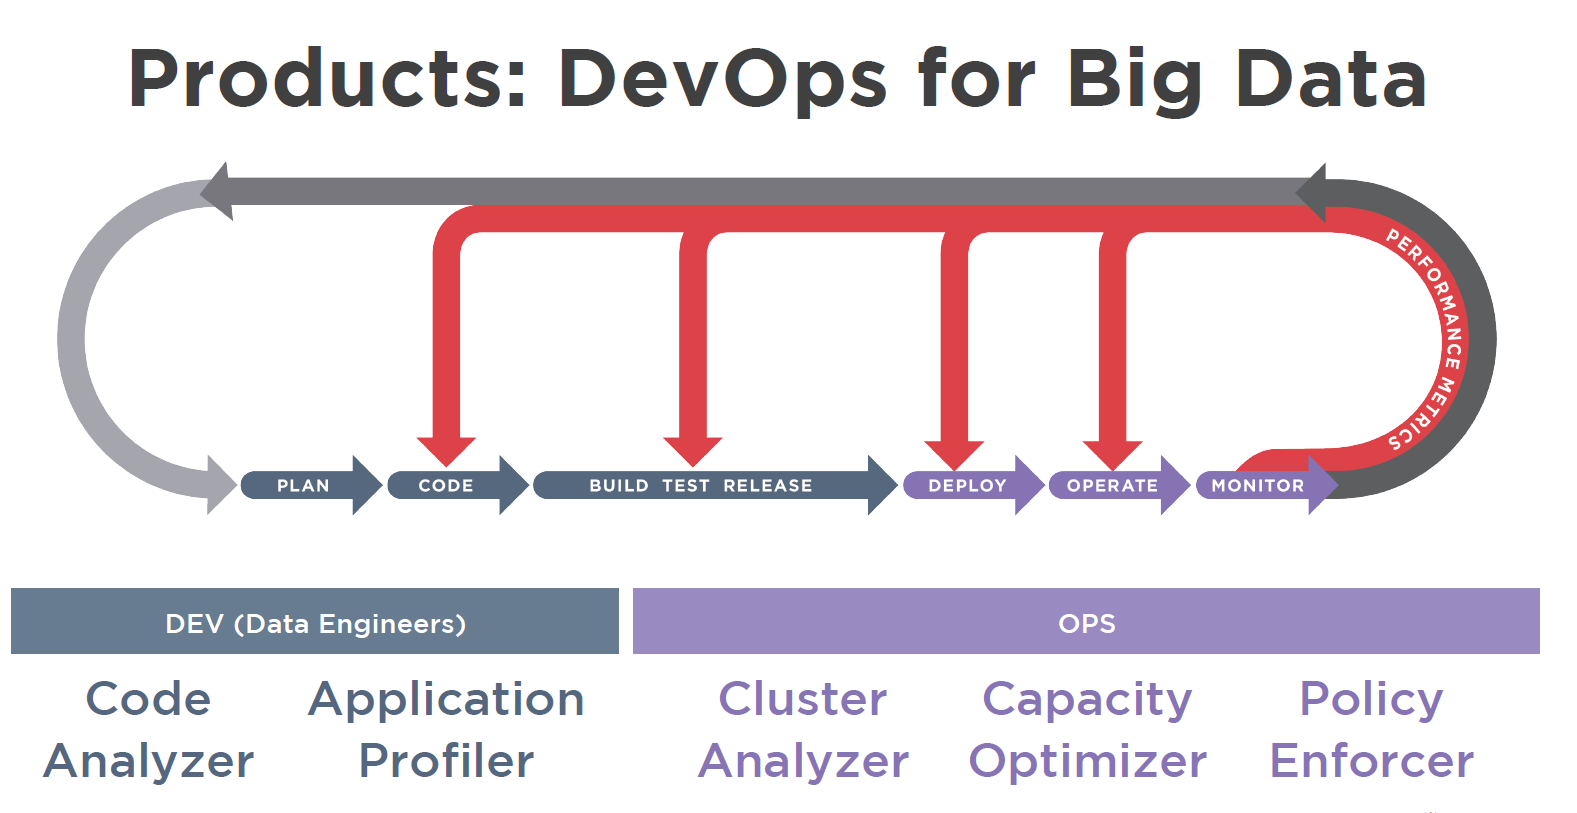
Pepperdata’s collection of “DevOps for Big Data” products
Code Analyzer works with other Pepperdata tools to provide developers the information they need to solve problems. The various products in Pepperdata’s suite can share a common interface and have links to one another, which speeds the remediation of problems.
“The developer might start with the Cluster Analyzer view, and see something is going wrong on the cluster, and see ‘Oh, it’s this app. It’s using too many resources,'” Carson says. “With the Code Analyzer, the developer can see exactly what was going on in real time in production when it was running, and with Application Profiler, they can get some heuristics and recommendation on how to tune the application.”
No other tools can provide that level of detail about Spark apps, Carson claims. “There’s a bunch of tools within big data and elsewhere that provide node-level information,” he says. “But there’s nothing for traditional MapReduce or Spark that’s even gathering the data or instrumenting down to the level of applications and tasks, what’s going on right now for every executor, on every node.”
Related Items:
Dr. Elephant Steps Up to Cure Hadoop Cluster Pains
Enforcing Hadoop SLAs in a Big YARN World
Leading Solution Providers


