


January 7, 2014
Logi Analytics Delivers ‘Data Scientist in a Box’
If you’re in the market for a data scientist this year, good luck. Demand for the rare professionals is quite high, so you’ll have to shell out the big bucks to get one. Alternatively, you might consider investing in software that tackles some of the data manipulation tasks that a data scientist would typically do. One such offering is Logi Vision, the new “data scientist in a box” product unveiled today by Logi Analytics.
![]() Logi Vision is a new Web-based data discovery tool designed to allow regular business workers to explore, analyze, and share data without requiring help from highly trained IT pros or data scientists. In addition to putting a friendly frontend on data profiling and analytic algorithms that would typically require the expert hands of a data scientist, Logi Analytics lets users share their discoveries using social media-like tools (such as Twitter or Pintrest) and also includes a recommendation engines to guide users to the best-fit data results (such as Amazon and Netflix).
Logi Vision is a new Web-based data discovery tool designed to allow regular business workers to explore, analyze, and share data without requiring help from highly trained IT pros or data scientists. In addition to putting a friendly frontend on data profiling and analytic algorithms that would typically require the expert hands of a data scientist, Logi Analytics lets users share their discoveries using social media-like tools (such as Twitter or Pintrest) and also includes a recommendation engines to guide users to the best-fit data results (such as Amazon and Netflix).
The idea is to deliver easier access to relevant information, says Brian Brinkmann, VP of products at Logi Analytics, which has been in the business intelligence business for about 10 years and has 1,200 customers in various industries around the world.
“The fundamental problem is that tools and information are being driven by the top 10 percent of individuals,” Brinkmann tells Datanami. “We fundamentally think that’s wrong. What we think needs to happen is we need to get the information out to the 90 percent of people who need the information to do their jobs and to help the company be more effective. We need to bring all this analytics, all this data science, to the people who need it most so they can make thousands of good decisions that turn to a competitive advantage.”
Logi Analytics has attempted to make data science available to the masses by masking the complexity of the underlying data profiling and data grouping algorithms in Logi Vision, and by making the user interface very easy to use. By “putting the data scientist in the box,” Logi Analytics hopes that the DataSmart component of the new product will enable regular business users to harness the algorithms and begin the process of transforming the “raw material” of data into useful information.
 |
|
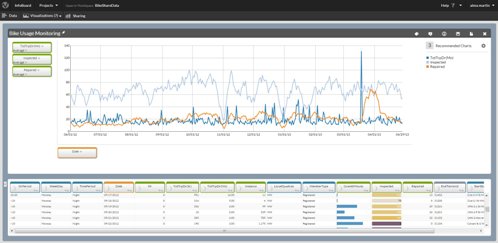
| Users are guided to the best-fit visualization with the ThinkSpace component of Logi Vision | |
The second component called ThinkSpace, employs a visual guide to help the user find the visualization that best fits the underlying data. This approach is needed because there is often so much information that it overwhelms the average user. “Even in a data discovery and interactive averment, there are too many possibilities and options. People get confused,” Brinkmann says. To address the issue, Logi Analytics employs a tactic successfully used by Amazon and Netflix: recommendation engines. “If I know something about you, I can recommend the information I find valuable,” he says.
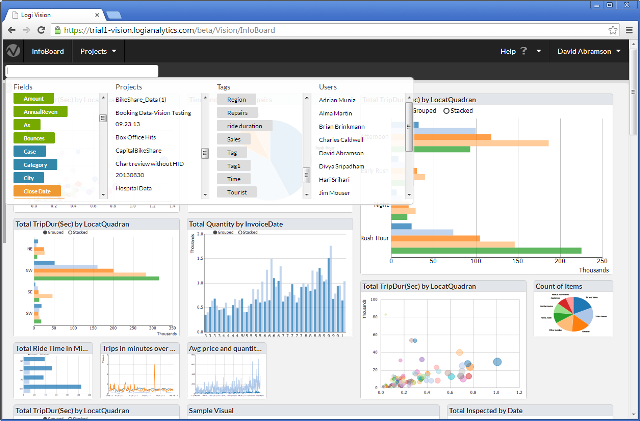
The third component, called InfoBoard, implements a Pintrest-like environment where users can share the information and the insights they’ve gleaned from the product. Logi Analytics borrowed another winning idea from the Web 2.0 world when it implemented ratings, rankings, and reviews into the InfoBoard. Today’s young workers who were raised on the Web are accustomed to ratings rankings, and reviews, and “demand this information inherently in what they do,” Brinkmann says.
Logi Analytics developed the new offering to complement its current flagship product, Logi Info. That product has garnered the company a certain degree of success in the business intelligence market, especially as a provider of embeddable, Web-based BI capabilities. The firm shared the “Challengers” quadrant with fellow BI vendor Birst in Gartner’s most recent Magic Quadrant for BI tools.
 |
|
| Users share data discoveries in Logi Vision through the InfoBoard component | |
Under the covers, Logi Vision runs on a Microsoft Windows IIS Web server, which is a requirement with the first version. The software utilizes a fast columnar database that Logi Analytics OEMed from Infobright. The software is designed to run in a server environment, but could be run on a laptop for testing. All client components are written in HTML5, enabling wide adoption.
Early tests show Logi Vision works well on data sets upwards of 50 million rows, according director of product management David Abramson. The software is designed for standard relational data, although the company is looking into how it can support more unstructured data in the future, he adds.
Data can be loaded into the Logi Vision data store from SQL-compliant databases through standard database connectors (sold separately). The company also offers a connector for Salesforce.com. While Logi Analytics has partnership with Hadoop vendors for analyzing Hadoop-resident data with its first-gen Logi Info product, Hadoop is not yet a supported source of information for Logi Vision.
Logi Vision is available now. Software subscriptions starts at $1,000 per user per year, and drop down to $500 in volume deals. For more information, see www.logianalytics.com
Related Items:
The 2013 Big Data Year in Review
Data Scientists–Who Needs Them Anyway?
Visualizing the Big Data Job Market
Applications:
Data Mining
Technologies:
Middleware
Sectors:
Financial Services
Vendors:
Startups and More...
Tags:
analytics
Leading Solution Providers


