

Tag: visualization

MLB Unravels Home Run Mystery with Analytics, Modeling and Simulation
Since the 2015 season, the ball has been flying out of Major League ballparks at a remarkable clip. While people had ideas about what caused the surge, nobody knew for sure. But now an in-depth analysis of hitting data a Read more…

Go Fast and Win: The Big Data Analytics of F1 Racing
What's the secret to winning in Formula One racing? Simple: Go faster than everybody else. But finding a lasting recipe for success on the racetrack today requires getting hundreds of variables right, so it's no wonder t Read more…

MapD Rolls GPU Cloud
MapD Technologies released a new version of its mainstay database and visualization platform about a year ago with a heavy emphasis on GPU acceleration. It is now migrating its analytics platform to the cloud with what i Read more…

Collaboration Database Tackles Policy Issues
Data collaboration startup Data.world released a list of its top data sets and collaboration projects that included journalists' efforts to trace social media's influence on the 2016 presidential election and a "Bitcoin Read more…

Alteryx Repositions for Analytic Tool Consolidation
Alteryx is best known for developing data preparation and blending tools. That's its historical position of strength in the market. But the vendor aims to change that in the future as it builds its platform and widens it Read more…

MongoDB, Tableau Expand Integration With BI Link
Database vendor MongoDB is again partnering with visual analytics specialist Tableau Software on an upgraded business intelligence connector designed to extend the merger of the two big data platforms to leverage Tableau Read more…

MapD Upgrades GPU-Based Database Performance
The latest version of MapD Technologies' flagship database and visualization platform reemphasizes GPU acceleration as a means of scaling data volumes and boosting query performance to "hundreds of billions of rows." Read more…

Four Ways to Visualize Big Streaming Data Now
Every day, the data deluge continues to grow. From clickstreams and transaction logs to mobile apps and the IoT, big data threatens to overwhelm customers relying on traditional BI tools to analyze it. That's creating Read more…
Hortonworks Unveils New Offerings for AWS Marketplace
Hortonworks today took the wraps off new big data services that run on the Amazon Web Services (AWS) Marketplace. The Hadoop, Spark, and Hive services are pre-configured, and are designed to get users up and running quic Read more…

Election 2016: A Rich Opportunity for Data-Centric Storytelling
Get ready to consume some data. If you're following the election today, you're likely to be immersed in it. Thanks to a new generation of interactive data visualization tools, news junkies have powerful new ways to inges Read more…

Drug Developer Wraps Anaconda Around Gene Data
An open source data visualization framework running on the Anaconda data science platform will be used by a drug discovery company focusing on cures for rare genetic diseases. Continuum Analytics, developer of the Bok Read more…

Tableau Automates K-Means Clustering in V10 Refresh
The upcoming release of Tableau 10 will introduce new features aimed at simplifying how customers use advanced analytic functions upon their data, such as a new k-means clustering algorithm that works in drag-and-drop fa Read more…

Inside the Panama Papers: How Cloud Analytics Made It All Possible
In late 2014, an anonymous person offered to send a German journalist 11.5 million encrypted documents detailing the structure of offshore business entities created and managed by a Panamanian law firm in the world's mos Read more…

New Platform Visualizes Open U.S. Data
Federal agencies are sitting on tons of data, particularly in areas like healthcare, employment, weather and education. A new initiative called Data USA seeks to unleash this trove via a free and open platform that colle Read more…

V.i. Labs Acquires S/W Usage Analytics Vendor
Tracking how application software is being used and misused is an emerging analytics market niche as user analytics vendors attempt to provide software developers with insights into preferred and little-used features whi Read more…

Platfora Riding High on Wave of Big Data Growth
The big data analytics business at Platfora is booming these days, accounting for 100 percent revenue growth this year. With a $30 million round in funding announced yesterday and software industry veteran Jason Zintak n Read more…

Data Visualization Shows Gender Discrepancies Among ACT Test Takers, Wins Award
Every dataset has a story to tell, and it’s Dustin Arendt’s job to uncover some of those stories. As a data visualization scientist at Pacific Northwest National Laboratory, Arendt works on algorithms that convert Read more…

Kaggle Tackles Whale of an Identification Problem
Kaggle has hosted lots of different data science competitions over the years, but none quite like the one launched by NOAA Fisheries earlier this year. The government agency, with financial support from MATLAB creator Ma Read more…
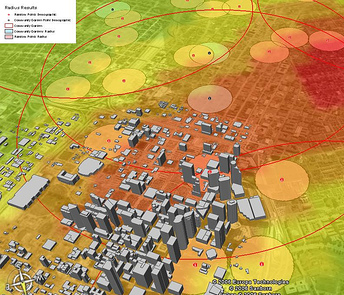
Predictive Analytics, Visualization Enlisted in Crime Fight
A visualization tool and predictive analytics package targeting law enforcement and public safety applications is said to be the first tool of its kind to combine real-time social media and Internet data feeds to help pr Read more…

Three Ways Zoomdata Makes Big Data Pop
When it comes to big data visualization tools, there's no shortage of players. Tableau, Qlik, Spotfire, and Microstrategy are established incumbents with big followings. But there's a fresh crop of visualization tools ma Read more…
Leading Solution Providers


Tabor Network
Sponsored Multimedia


Featured Events
-
Call & Contact Center Expo
 April 24 - April 25Las Vegas NV United States
 -
AI & Big Data Expo North America 2024
 June 5 - June 6Santa Clara CA United States
 -
AI Hardware & Edge AI Summit 2024
 September 10 - September 12San Jose CA United States
 -
CDAO Government 2024
 September 18 - September 19Washington DC United States