

September 6, 2012
IBM Reveals “Keys to the Match” for US Open
While some might say that sports represent a microcosm of life itself with the various wins and losses, IBM prefers to see sports as a metaphor for business.
 At this year’s US Open, the analytics team is combining the uncertainty of sporting glory with the presumed steady beat of predictive analytics in an effort to identify which players are most likely to win matches. “By using sports as a metaphor,” said Deepak Advani, IBM’s head of predictive analytics, to Datanami this week, “we can talk to our clients about what kind of outcomes predictive analytics can drive.”
The cornerstone of their predictive analytics showcase is their Keys to the Match, a concept that compiles millions of historical data points to determine what a player needs to accomplish to have a better chance at winning.
The concept of “keys to the match” is not new. Commentators typically deliver their “keys” before sporting events. However, usually those keys are formed from memory and intuition. Sometimes, analysts will even go so far as to glance at statistics. But all that amounts to is a statement akin to the following: “well, Football Team X is really bad at stopping the run. If they improve that, they will be much better off.”
A layperson could glean that expert insight in about two seconds by simply looking at a rush defense table. On the other hand, IBM offers highly specific keys for each match. As Advani put it, “We were basically able to gather the 39 million data points and by analyzing all that data, for each match, we can identify what are the three things that the player needs to do to improve his or her chances of success against their opponent.”
Take Tomas Berdych’s upset victory over Roger Federer in Wednesday night’s quarterfinal match for example. Before the match, IBM identified three key factors for each player. For Berdych, those keys were “Win more than 46% of three-to-eight shot rallies, win more than 55% of points after a rally of nine or more strokes, and have an average first serve speed of less than 118 miles per hour.” For Federer’s keys were “Win more than 32% of first serve return points, win more than 55% of three to eight shot rallies, and win more than 78% of points on first serve.”
As the match progressed, IBM tracked each player’s momentum not in terms of how the points and games were going, but how each was faring with respect to their keys. Berdych was fulfilling his keys while Federer was not, and Berdych took the first two sets. The match took an interesting turn in the third set from an analytic perspective, as Federer won to halve Berdych’s lead. At that point, commentators suggested that the momentum had swung in Federer’s favor. IBM knew better. Berdych was still hitting his keys, and he took the fourth set and the match.
An important factor here is that none of these insights should be particularly shocking. Nine-shot rallies are long in tennis, and can be draining for an older player like Federer. Winning a large majority of those instilled confidence in a lower-rated player like Berdych and wore out Federer. However, few would think to be that specific by simply watching a lot of tennis.
Advani related a tale where an insurance company used those same predictive analytics to identify keys in potential fraudulent claims. “One of our clients at an insurance company told me, ‘When we ran your algorithms, we found something pretty interesting. Once we saw the insight, it’s pretty obvious. But we didn’t know that before. Of all the parameters we capture for arson, one of the key predictors ends up being that if someone’s got tents and takes the tents out of the house before the house burns down, then perhaps this was an arson-related case.’”
Of course, it makes logical sense that someone taking tents out of their house before it burns down may have been planning ahead to set up temporary residence in their tent after intentionally setting their house aflame. But as Advani’s client said, one may not necessarily consider that variable. That, according to Advani, is the value of predictive analytics.
NEXT – Extending the Metaphor >
Predictive analytics’ usefulness in sports is not limited to tennis. European soccer clubs are using it to prepare for a key player’s potential injury. “In Europe,” Advani said “they’re using these analytics to predict injuries to players. What they basically do is analyze the data, how intense workouts have been, how long they’ve been out there on the field, and using analytics to predict when a player is likely to get injured and take actions accordingly.”
AC Milan caught on to this several years ago, using predictive analytics to find an unlikely connection between a player’s jump and the likelihood of injury. As a result, while most soccer players peak in their mid-to-late 20s, AC Milan won a Champions League title in 2007 with a roster that featured several players over the age of 30, including 38-year old captain Paolo Maldini.
Likewise, as Advani notes, businesses can use those analytics to predict mechanical failure. “Those same type of analytics can be used to predict when automobiles are likely to fail. In the energy sector, companies are using those same analytics to predict when there are problems with a nuclear power plant or an oil pipeline.” Other notable examples include NASA using predictive and text-bases analytics to predict potential airplane failure and the advancement of personalized medicine.
In sports, as in real life and business, it is incredibly difficult to distinguish between cause and effect. A football team that rushes for 150 yards in a game is likely to have won that game. However, while sometimes a strong rushing attack wears down a defense which results in victory, frequently the glutton of ground yardage is a result of having a lead late in the game and keeping the ball on the ground to chew clock. In that case, rushing for 150 yards is an effect, not a cause.
Advani was very aware of that distinction between correlation and causation. “One of the key things you need to determine is causality. We have dozens of different algorithms that analyze your historical data that determine with some amount of certainty what the correlation and causation is. Providing that level of causality is one of the key things the algorithms do.”
As noted above, those algorithms do wonders in determining who will win a given tennis match. However, tennis is a sport that has been played for decades with minimal rule changes. While there are certainly shifts in strategy, Advani noted that the drop shot is more popular than it was three years ago, the game remains mostly the same and the data, going back seven years across 28 Grand Slams, remains relevant.
On the other hand, businesses are just now engaging in the game of using social media analytics to enhance their marketing efforts. “The way consumers acquire product, the way they get support, all of that is changing on its head. So analyzing data from five to ten years ago isn’t as relevant as looking at what’s happened in the last twelve to eighteen months.”
As a result, IBM’s business analytics need to be quicker, weighing the recent data more heavily and implementing the cognitive abilities that IBM displayed a few years ago on Jeopardy. Advani is optimistic. “We’re really focusing on building causative systems that are constantly evolving and getting smarter based on what’s happening in the markets. We’re headed more and more toward real time analytics, toward systems that are cognitive and getting smarter over time.”
NEXT – The Real Keys to the Match >
As the US Open progresses, fans can follow who is more likely to win by following IBM’s Keys to the Match. As that happens, businesses see IBM’s predictive analytics work effectively in real time.
 There is no substitute for heading up to New York to witness the pageantry that is tennis’s final major. Traipsing around Flushing Meadows for two weeks, walking into iconic Arthur Ashe Stadium, those are experiences even non-sports fans can appreciate. However, IBM continues to be instrumental in improving the experience of the fan at home.
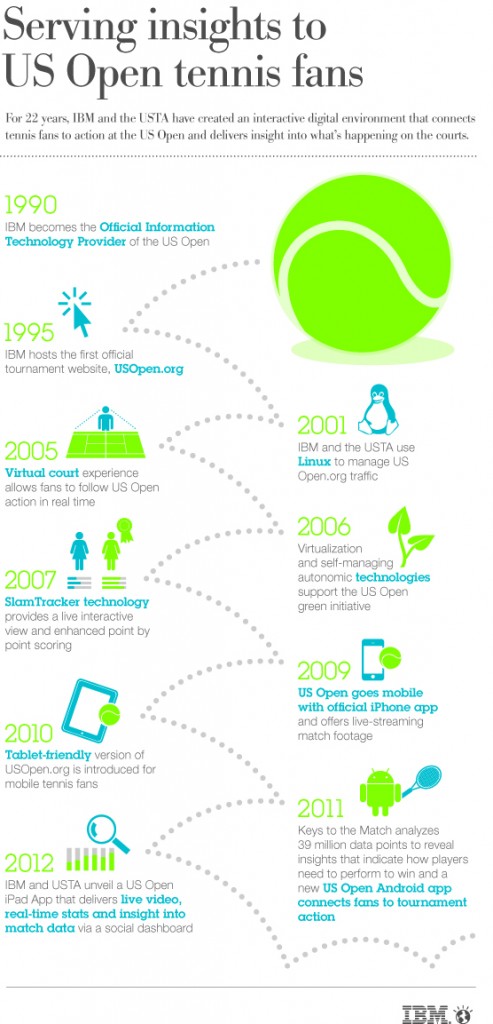
From joining with the US Open in 1990, IBM set up the tournament’s website, made it possible for each match to be streamed on television or online, and are now giving fans to insightful, exciting new statistics.
That being said, IBM is not leaving those in New York out in the cold. They built an impressive interactive fan wall which shares just as much data with some entertaining visualizations. “Things start to get interesting when fans can select the matches that are ongoing. They can pick a match and they can get access to stats immediately using some playful and intuitive visualizations…You can also get a sense of who’s getting the greatest buzz in social media, you can get a sense of if the buzz is positive or negative. You can get to the next level of detail which the fans are finding quite interesting.”
One of those visualizations features the two players in a given match running on a ball. The players run slow or fast based on their respective momentum (again, measured relative to fulfilling IBM’s keys).
All of this serves to increase IBM’s visibility to prospective clients at a major American sporting event. But this is about more than brand recognition. Those prospective clients not only see IBM at the US Open, they see IBM performing at the US Open, and performing well.
Leading Solution Providers


Tabor Network
Sponsored Multimedia


Featured Events
-
Call & Contact Center Expo
 April 24 - April 25Las Vegas NV United States
 -
AI & Big Data Expo North America 2024
 June 5 - June 6Santa Clara CA United States
 -
AI Hardware & Edge AI Summit 2024
 September 10 - September 12San Jose CA United States
 -
CDAO Government 2024
 September 18 - September 19Washington DC United States