
(unicro/Shutterstock)
Tracking down sources of data quality problems is a notoriously difficult task. But with its update to its Data Intelligence offering, Rocket Software is giving users the ability to navigate their organization’s data landscape in a graphical manner, which it likens to a “choose your own adventure” for data lineage tracking.
Rocket Software has been selling the Data Intelligence suite since it obtained it with the acquisition of ASG Technologies in 2021. The software previously was aimed at enabling highly skilled data engineers to tackle data quality problems, predominantly in highly regulated industries like financial services, often with a lot of mainframes.
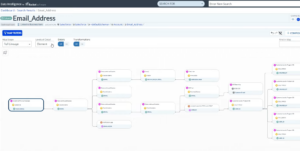
This month, the company rolled out a major refresh of Data Intelligence designed to put actionable data lineage information in the hands of a much larger pool of business users. A big component of that work was creating a new graphical interface, called Data Intelligence Explorer, that depicts the organization’s data in a map-like manner.
The product functions a bit like Google Maps but for data lineage instead of the physical world, says Chris Wey, who is president of Rocket’s Data Modernization practice.
“Google Maps is a really intuitive way to zoom in and zoom out in a very user-friendly way,” he tells Datanami. “So if you zoom all the way into an intersection, for example on Google Maps, you can see the crosswalk, you can see the traffic lights, you can see what’s happening at that intersection. But as you zoom out, you get this abstraction and the details go away, but you can see the total picture.”
As the user zooms into a data entity in Data Intelligence Explorer, they’re able to see the actual database records that are the source, as well as any data transformation routines that may be modifying the data before it ends up in a BI report or dashboard, Wey says.

The new Data Intelligence Explorer provides a “choose your own adventure” for tracking data quality problems, Rocket Software says
“If there’s an ETL attached to that, what is the transformation? Are you adding three leading zeros to this number? Are you appending this ZIP Code with country code or whatever the case may be?” Wey says. “When you zoom out, you can now see your entire enterprise, all of the systems, from start to finish, and you can see different abstractions. You can see the sensitive data. You can zoom into other parts of your organization. And so that’s the simplicity that we’re bringing, this idea of lineage diagrams, which we think is going to be really powerful for business users.”
The GUI provides a “choose your own adventure” approach that will allow regular business users to begin tracking down data quality issues, Rocket says in a YouTube video on the new product. It’s a big improvement on the existing Data Intelligence product, which offered a GUI that wasn’t very easy to use, Wey says.
“You needed to be an expert,” he says. “You really need to understand the details of what was happening. And the way to zoom in and zoom out wasn’t just with the click of a mouse or a plus and minus button. There were specific functions to do everything you needed to do in the old product. So it was just not as user-friendly.”
That difficulty limited the old product to more technical users, such as data engineers or BI experts. With the new product, any user with a question about the source of a particular piece of information in their Tableau report or Looker dashboard will have a way to begin understanding where it came from. They’ll be able to start understanding what happened to that data while it was traveling from the transaction system, through the ETL tool, into data warehouse, and ultimately their BI tool or dashboard.
“You don’t have to go to IT and open up a ticket every time you want to understand where your data comes from,” Wey says. “You can click on the application, find your report, drill down into the source of the data and say, ‘Well my number came from this field in NetSuite and the other guy’s using the other field in NetSuite. Is it currency adjusted? Maybe the currency adjustment had an impact on your using the plan rates versus the actual rates on the currencies and that led to the difference in the outcome, for example.’”
Business users won’t have the ability to fix every data problem detected with Data Intelligence Explorer, Wey says. In many cases, a technical expert from the IT department may ultimately be needed to fix the problem. But the capability to follow the lineage of particular pieces of data as it navigates from a data sources through a transformation and into final report will help to spur conversations and ultimately lead to quicker, better resolution, he says.
Data Intelligence doesn’t actually track each individual piece of data as it flows within an organization. Such a system is probably impossible to build. Instead, the product relies on metadata to build a model of the data flow within an organization. It supports a catalog of 200 connectors and scanners to gather this metadata from various transaction systems–from cloud-based ERP systems to IBM mainframes and IBM i servers, as well as data warehouses, ETL tools, and BI tools.
It also uses tags to track specific pieces of high-value data, like personally identifiable information (PII). Tags are useful for enabling traceability, Wey says, but they often get lost amid the myriad complexity and massive volume of enterprise data systems. Simplifying the interaction with the metadata-derived lineage diagrams is the path that Rocket chose to bolster usability with this release.
“These lineage diagrams are incredibly complex. If you think about hundreds if not thousands of applications and all of the connections to all of the data fields and diving in and out of these complex diagrams–it’s incredibly complex,” he says. “This lineage is incredibly useful in providing that clarity for business reports, for compliance reports. But the big desire that we’ve had for customers over the years is to expand this simplicity and the ease of use for our business users.”
Rocket also rolled out a more attractive licensing mechanism aimed at getting Data Intelligence Explorer, which is a Web-based product into the hands of more users. The old interface is still there, too. For more information, see www.rocketsoftware.com.
Related Items:
Data Quality Is Getting Worse, Monte Carlo Says
November 8, 2024
- UnifyApps Raises $20M Series A to Deliver AI Agents Across the Enterprise
- PuppyGraph Raises $5M to Bring Real-Time Graph Analytics to Enterprise Data Lakes
- Brillio Unveils AI Upgrades to BrillioOne.ai for Streamlined Development
- SiMa.ai Launches Palette Edgematic on AWS Marketplace, Scaling Low Code Development for ML at the Edge
November 7, 2024
- Nutanix Expands Partnership with AWS
- Redgate Launches Advanced AI Capabilities Across Its Database DevOps Portfolio
- Diliko Launches Agentic AI Platform, Enhancing Data Management for Mid–Sized Enterprises
- Cerabyte Discusses Use Cases for Its Ceramic Data Storage Solution at SC24
- Tintri Introduces Advanced Kubernetes Data Management with New VMstore CSI Driver
- Elastic Simplifies Elasticsearch Management with AutoOps Integration
November 6, 2024
- Arcitecta to Showcase New Data Management Solutions and Collaborative Presentations at SC24
- AtScale Launches Open Text-to-SQL Leaderboard for Transparent, Standardized Data Query Evaluation
- Lightbits Now Certified on Oracle Cloud Infrastructure
- Nutanix Positioned Furthest in Vision Among All Vendors in 2024 Gartner Magic Quadrant for File and Object Storage Platforms
November 5, 2024
- Grafana Labs Strengthens Cloud Native Ecosystem with Major OpenTelemetry and Kubernetes Monitoring Updates
- NTT DATA and Google Cloud Expand Partnership to Drive AI and Data Analytics in APAC
- Rackspace Expands Spot Platform with On-Demand NVIDIA GPU-as-a-Service for AI Workloads
- Tenstorrent to Build Japanese Engineering Talent with US-Based AI and RISC-V Training
- Qlik Opens Registration for Qlik Connect 2025


