

May 30, 2023
Why Roblox Picked VictoriaMetrics for Observability Data Overhaul

(Miguel Lagoa/Shutterstock)
With more than 200 million active monthly users, Roblox is one of the most popular gaming platforms on the Internet. But all that global traffic means an enhanced need for infrastructure and application observability. The company started with Prometheus and InfluxDB, but as volume continued to build, Roblox eventually adopted a time-series database called VictoriaMetrics.
Roblox may seem like an overnight success story, but the massively parallel online gaming platform actually traces its roots back to 2006. The platform grew slowly at first, but since the COVID lockdowns, growth has been on overdrive. By July 2020, PC Gamer magazine declared Roblox was the game of choice for half of all US kids.
That sudden growth coincided with a substantial rebuild of Roblox’s observability system, which informed internal users about everything from the condition of Roblox application servers and storage infrastructure to the number of players and player experience.
The original observability system was largely homegrown, consisting of some open source software and internally developed tools. It was based on a decentralized model and leveraged individual Prometheus and InfluxDB instances to store data streaming in from the infrastructure and the platform, which internal Roblox users analyzed using Grafana and an internally developed tool called RCity, according to a presentation by two Roblox engineers at ObservabilityCON 2023.
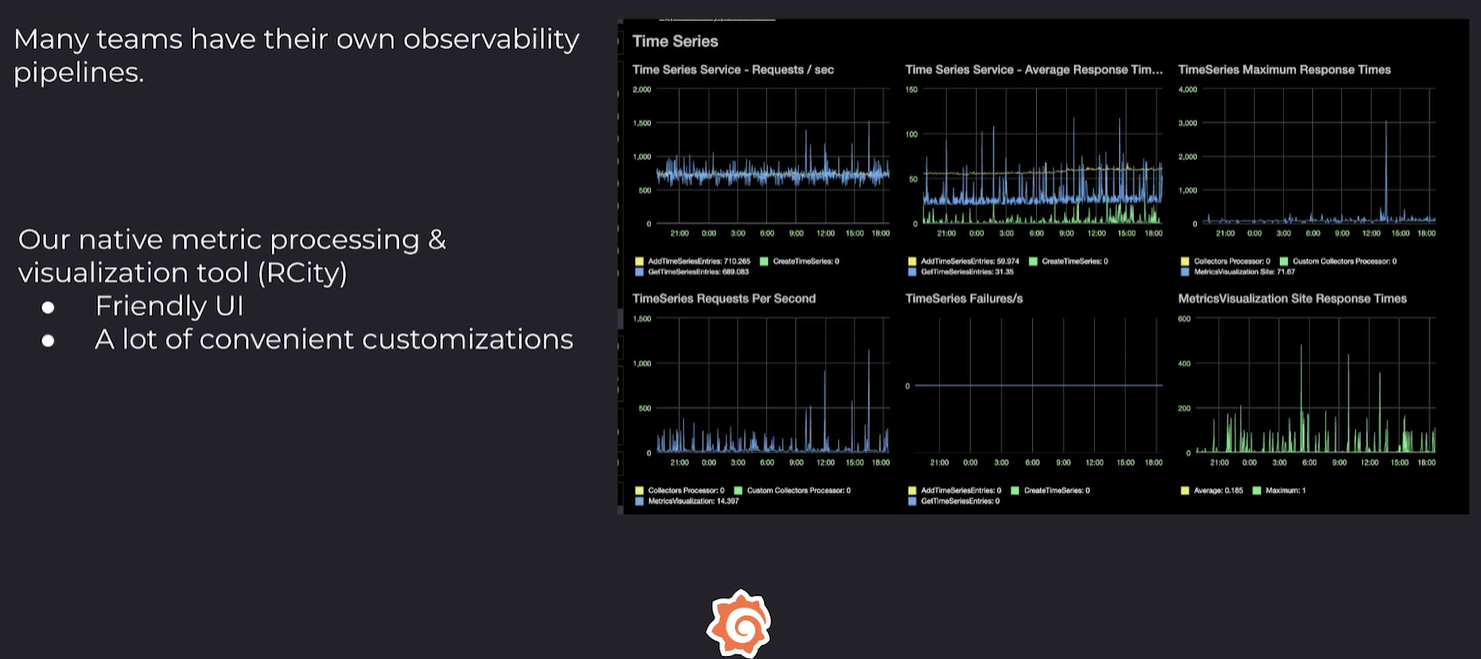
Roblox had a plethora of different observability solutions in place before centralizing on Grafana and VictoriaMetrics (Image source: Roblox)
“There were many teams that had their own stack. They either brought up their own Prometheus instance or InfluxDB, and even have their own Grafana setup,” Roblox Principal Engineer Ying Dai said in the presentation. “At that time, we had maybe six different teams have their own Grafana instances across Roblox.”
This led to several pain points. From a usability perspective, there was no central repository for data or analysis, and engineers had to jump around to different tools to get what they needed, Dai said. It also hurt Roblox’s flexibility to know how the platform was working in a new region or a new country.
And while the simplicity of storing data in key-value pairs aided visualization, it made doing in-depth analysis a real pain. “Because the underlying storage was key-value pairs, we had to do a lot of hacky things and extreme parsing around the keys just to get the segmentation for that new region, new country,” she said.
Lastly, the homegrown observability system hurt reliability for Roblox. That was the biggest pain point, Dai said, because it hurt Roblox’s capability to maintain the dashboards and alerting necessary to sustain Roblox’s high growth.
That lack of reliability was tough to stomach for the Robloxers.
“We’re responsible for making Roblox highly available,” Roblox Director of Engineering Xiaofeng Han said during the presentation at ObservabilityCON 2023. “Just imagine how sad your kids would be if Roblox is slow or not available or your experience is shaky.”
Distributed Time-Series Observability
One of the big changes Roblox made was replacing the smattering of Prometheus and InfluxDB instances with a single time-series database to hold the raw observability data. The company selected VictoriaMetrics, a young San Francisco-based startup.
According to VictoriaMetrics co-founder Roman Khavronenko, the company was created when he and his co-founder, Aliaksandr Valialkin, discovered that Prometheus could not scale effectively to handle the growth of monitoring data for a separate project they were working on for a private company.![]()
“We used Prometheus because Prometheus was very popular at that time,” Khavronenko told Datanami. “But at some point, we saw that Prometheus has its limits in scalability.”
The problem was relatively straightforward: Prometheus could scale vertically, but not horizontally. With the rise in containerized applications running atop platforms like Kubernetes, the need for horizontal scalability became a stumbling block for Valialkin and Khavronenko.
So they did what any good technologists would do: They created their own product. Valialkin had a knack for writing “really performant and optimized code,” Khavronenko said. “He made a proof of concept and called it VictoriaMetrics after his wife.”
They posted it on GitHub in the fall of 2018. By the beginning of 2019, VictoriaMetrics had its first paying customer. While there have been projects to make Prometheus parallel since then, VictoriaMetrics, with its open source time series database, was in the right place at the right time to catch the wave in growth of observability data.
Since early 2019, the company and its associated open source project have both grown fast. The project has had more than 100 million Docker pulls and more than 2 million GitHub downloads. There are thousands of users, and more than 100 contributors (but the company retains tight control).
In addition to providing parallelism where Prometheus could not, the popularity of Kubernetes has played a big role in the need for a distributed, shared-nothing time-series database for observability data in the first place, Khavronenko said.
“A default cluster which runs no workload, just the cluster of Kubernetes, it exposes…a thousand metrics,” he said. “[Customers] are using 25% of those metrics which Kubernetes exposes and 75% are not used. Never. But you need to store them. You need to pay for them.”

K8s is responsbile for much of the growth in observability data (Image source: Pepperdata)
VictoriaMetrics offers the distributed capability as part of the open source project. Customers like Roblox pay for the technical support and for additional security features, Khavronenko said. Over the past year, the company has grown revenue by 250%, he said.
Roblox Overhauls Observability
The folks at Robolox didn’t toss out everything from their original siloed observability system. As they moved into the centralized world, they kept Grafana “because we believe it’s scalable enough and flexible enough and good for our needs,” Roblox engineer Dai said.
“We also choose to use VictoriaMetrics as our metrics pipeline,” she said. “We choose to use VictoriaMetric because we did several benchmarking a couple years ago. VictoriaMetrics has worked pretty well for us.”
By all accounts, the move to VictoriaMetrics and Grafana has been a success. With a centralized telemetry database and visualization system, Roblox engineers don’t have to hunt around for different tools when problems arise, which was source of delay before. The new setup has also helped Roblox deliver 100% availability for three straight quarters, despite moving a massive amount of data, Dai said.
“We have 120 million data points per second ingesting into our VictoriaMetrics cluster,” the Roblox engineer said. “It’s kind of amazing just to see how people are using our metrics pipeline and we’re still seeing very fast growth.”
Roblox relies on Grafana for traces, which is something that the folks at VictoriaMetrics are looking to add in the near future, according to Khavronenko. In the meantime, Roblox is happy with how its observability system is working, particularly when it comes to how much easier it is for internal users to glean insights from all that data.
“Fundamentally, it’s not about how much data you store in your system,” said Han, the Roblox engineering director said. “It’s about the true value people can get from all the data.”
Related Items:
Observability Overload: Grafana Labs Survey Builds a Case for Centralized Solutions
Observability Primed for a Breakout 2023: Prediction
Open Source Times Series Database VictoriaMetrics Sees Significant Growth
Leading Solution Providers


Tabor Network


