

June 14, 2022
Splunk Shows Off Automated Anomaly Detection and More at .Conf22
Splunk kicked off its .conf22 user conference today by unveiling a host of updates to its core platform, including a demonstration of an automated anomaly detection system based on machine learning of time-series data and Splunk Log Observer Connect, which lets customers see all their observability data in one place.
Splunk has been able to detect anomalies for a while on time-series datasets, Splunk SVP Chief Product Officer Garth Fort said during a press conference last week. Calling the algorithm requires just 15 lines of SPL, the Search Processing Language at the heart of the platform, he said.
“But getting it right is tricky,” Fort said, “and it’s often an iterative process of trial and error.”
For example, to keep the number of false positives and missed events down, it required the user to carefully set the maximum and minimum detection levels, and tuning the parameters of the anomaly detection algorithm took more time, he said. But all that that trial and error should be minimized as a result of the new anomaly detection functionality it’s building into its platform.
“We’re going to be demoing a capability to automatically tune those parameters in a way that allows you to get much more accurate anomaly detection on time series datasets,” Fort said. “That’s useful for security events, looking for kind of anomalous behavior and log on behavior, for example. It’s also useful for observability, like being able to detect when systems are performing outside of their normal parameters.”
Observability should also be improved through the launch of Log Observer Connect, a new offering in Splunk version 9, which it unveiled today at .conf22, which is taking place in Las Vegas, Nevada, and virtually.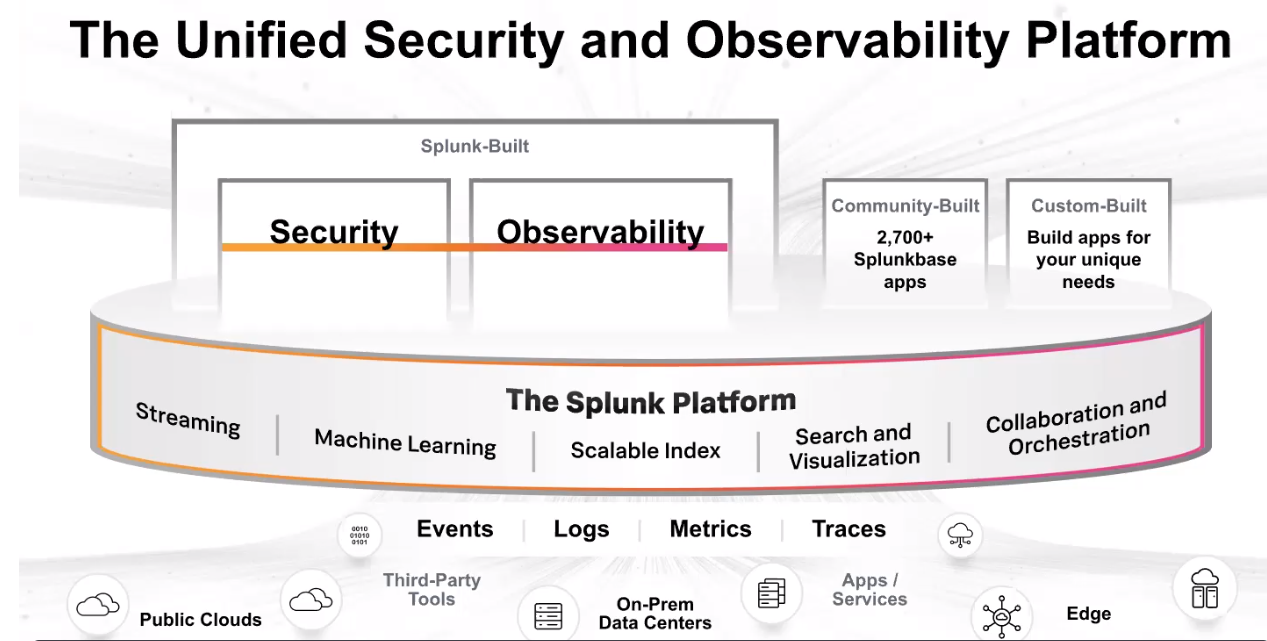
Log Observer, which is a point and click interface that allows users to explore logs without knowing SPL, has been around for a while. Log Observer Connect will improve how log data is ingested into Splunk Cloud Platform.
“So if you if you are an existing Splunk customer and you’ve got a number of those logs already indexed and sitting in a Splunk instance, whether that’s on cloud or premise, Log Observer Connect allows your site reliability engineers and your IT operations professionals to use that port and click interface against an existing Splunk index,” Fort said.
Another new product feature that will drive cohesion across Splunk’s product lineup is the addition to Splunk’s federated search capability. The company says it’s “enhancing and simplifying” how users search and investigate across hybrid cloud environments by giving them “a unified, single pane view” of their entire Splunk ecosystem.
“Federated search actually will allow you to search across both Splunk and non-Splunk data sources,” Fort said.
Processing data at the edge will improve with the launch of Ingest Actions, which are new features that let users filter, mask, and route data as it makes its way from the edge to the Splunk platform or AWS S3 storage.
Splunk announced the preview of Ingest Actions last year, and now they’re officially available. Fort predicted that the features were going to be very popular.
“Not all data has the same signal to noise ratio, especially if the customers who are on the ingest pricing model with us,” he said. Those customers “like being able to control the volume of data that gets ingested from the” edge.
Related Items:
Here’s What Splunk Announced Today at .conf21
OpenTelemetry Gains Momentum as Observability Standard
Splunk Makes a Whirlwind of News at .conf20
Vendors:
Splunk
Tags:
.conf22, anomaly detection, big data, events, logs, machine learning, MELT, metrics, observability, time-series data, traces
Leading Solution Providers


Tabor Network
Sponsored Multimedia


Featured Events
-
Call & Contact Center Expo
 April 24 - April 25Las Vegas NV United States
 -
AI & Big Data Expo North America 2024
 June 5 - June 6Santa Clara CA United States
 -
AI Hardware & Edge AI Summit 2024
 September 10 - September 12San Jose CA United States
 -
CDAO Government 2024
 September 18 - September 19Washington DC United States