

November 4, 2021
Visualizations That Make You Go ‘Hmmm’
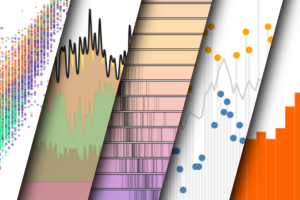
(Image courtesy Observable)
When it comes to big data, advanced analytics, and AI, we’re conditioned to expect the big “aha!” moment. We expect to see the crazy-haired data expert leap out of bed, saying something like “By George, I think I’ve got it!” But for Zan Armstrong, a data visualization engineer with Observable, the big breakthroughs are more likely to start with a simple “hmmm, that looks strange.”
Armstrong has a keen eye for a good visualization, and an engineer’s appreciation for how hard it can be to turn a bunch of seemingly random data into something with obvious value. Where others see noise at the edge of the data set, she detects a faint signal, and seeks to bring that signal out into the light for others to see. Such is the art and science of using the right visualization for the right set of data.
Armstrong honed her visualization skills in two non-consecutive stints at Google, including five years as a data analyst on the revenue team and another four with the Applied Sciences team at Google Research team working with machine learning engineres, scientists, and statisticians make discoveries. Earlier this year, she joined D3-creator Mike Bostock and Melody Meckfessel’s San Francisco startup Observable to help others use its visualization platform to surface insights that can be hard to spot.
Machine learning algorithms are all the rage, and they clearly have lots of great uses. Deep learning techniques are giving human-like sensing capabilities to computers, and in some cases exceeding humans.

Human intelligence still beats artificial intelligence in many situations (MY-stock/Shutterstock)
Despite the advances in AI, we shouldn’t overlook the tremendous power of the human frontal cortex, which has developed distinct pattern recognition capabilities developed over millennia. With the right graphical presentation of data, our brains can spot patterns or anomalies that AI still cannot.
“When I was working with AI researchers, sometimes there’s a question about, ‘Well, why are we visualizing? Can’t we just write an algorithm?” Armstrong tells Datanami. “And I always found that every time [I visualized] somebody’s data set, I would find something new, something that they hadn’t noticed before. Our brains are so powerful.”
Recently, Armstrong and two Observable colleagues, Ian Johnson and Mike Freeman, set out to demonstrate the power of visualization with time-series data. They picked a recent event–the snowstorm that knocked out the Texas electric grid in February–and then gathered publicly available data sets that described it, including weather data from NOAA and electricity data from the US Energy Information Administration (EIA). Then they analyzed it with Observable Plot, a new notebook-style visualization collaboration product that the company announced earlier this year.
The goal wasn’t necessarily to show something new in the event that others had missed, Armstrong says. The Texas Tribune had already done a great job documenting the snowstorm and resulting blackout, which left millions of Texans without electricity, she says.
“Our goal was really to get people to say, hey I have data like this too. I have data that looks like this,” she says. “And maybe it’s something else. But could I do the same thing too? How could I change how I look at my data?”
Time-series data is unique because it has built-in patterns that are driven by human behavior. Electricity consumption varies hour to hour, day to day, and week to week, and the goal is to tease out the causes of the phenomenon, and the possible effects it might have.

The gap between predicted energy consumption and actual energy consumption in Texas in February (Source: Observable)
Armstrong was thrilled to be using Observable Plot. “My two favorite charting languages before Observable Plot were D3 and ggplot in R,” she says. “And Observable Plot is basically my two favorite things had a baby.”
With Observable Plot, the three visualization experts were able to collaboratively work with the same data set, testing hypothesis and seeing how the data looks from different angles. The ability to have three visualization experts working not only within the same notebook, but within the same cell, was unique.
“It was really special,” Armstrong says. “All three of us were in it, and we’re like ‘Try this! Try this! Try this!’ and suddenly we’re like, ‘Whoa, this so cool.’”
Specifically, the group zeroed in on the differences between the predicted demand and the actual demand, which they wrote about in an October 4 blog post. While one might think that a simple line chart with the two values would be the simplest and best way to show the difference, that doesn’t do justice to the underlying data, Armstrong says.
“It’s a perfectly good chart,” she says. “But if what you really care about is the difference between forecast and actuals, just make that visible. This is another really big theme for us, which is make the important visible. If you care about differences, make sure that you can see differences.”

Zan Armstrong (Image courtesy Stamen Design)
Understanding the magnitude of the differences is important too. In the Texas Blackout viz, there were wild swings in energy generation, ranging upwards of 200%. In other situations, a seemingly more mundane change of 10% could itself be considered massive.
This brings up another important point that Armstrong wants to make: Telling the signal from the noise.
“The typical approach so often is to aggregate away the complexity, because when you have a typical line start like this, it’s just so spikey,” she says. “Instead of aggregating away the information, if we can actually just change how we’re looking at it, suddenly things that look like noise or look like distractions become the signals in the data, become the signals.”
To be sure, some folks have natural gifts for seeing signals where others only see noise. Some have greater algorithmic abilities in our cortexes than others. But through the collective power of data and intuitive software, tools like Observable Plot can help a person see the data in a new light, and ultimately (hopefully) get us closer to that “aha” moment.
“It’s about that ‘Huh, that looks funny’ moment, not nearly that Eureka moment,” Armstrong says. “In many cases, that crux moment of discovery feels a lot more like ‘Huh, that looks funny,’ than Archimedes running down the street out of his bath naked, which is the original Eureka story.”
We have come a long way since Archimedes’ days. Most of the major scientific principles (we think) have been discovered. The past 50 years, in particular, have not yielded much, some scientists say. But we do have an unlimited supply data, much of it containing some insight about the human condition. With the right perspective and proper degree of curiosity, it can be discovered and put to use.
Related Items:
Observable Seeks Democratization of Data Visualization
Four Key Attributes of Advanced Anomaly Detection
Big Data Outlier Detection, for Fun and Profit
Vendors:
Observable
Leading Solution Providers


Tabor Network
Sponsored Multimedia


Featured Events
-
Call & Contact Center Expo
 April 24 - April 25Las Vegas NV United States
 -
AI & Big Data Expo North America 2024
 June 5 - June 6Santa Clara CA United States
 -
AI Hardware & Edge AI Summit 2024
 September 10 - September 12San Jose CA United States
 -
CDAO Government 2024
 September 18 - September 19Washington DC United States