

October 19, 2021
Here’s What Splunk Announced Today at .conf21
Today marked the start of .conf21, Splunk’s annual user conference, which the company traditionally uses to unveil enhancements and customer success. This conference proved no different, as the big data vendor released a slew of product updates across its many products, notably its cloud-based observability line and Splunk Enterprise, its flagship offering that runs in the cloud and on-prem.
For starters, Splunk announced a pair of enhancements to Splunk APM, its application performance management offering. Currently in preview, the new the AlwaysOn Profiling for Splunk APM capability will provide “continuous code-level visibility” into application traces to help IT personnel find and fix problems, the company says. Enhancement to its Database Visibility for Splunk APM will “automatically uncovers slow queries that are causing transaction latency, without having to instrument [customer] databases.”
Many Splunk customers use the vendors offering to monitor and troubleshoot mobile applications. To that end, the company announced its new Splunk RUM for Mobile Applications that’s is based on OpenTelemetry, a new standard that Splunk is actively adopting.
Splunk is also starting to adopt OpenTelemetry in its flagship on-premise platform, Splunk Enterprise. It’s coming in the form of an integration (currently in preview) between Splunk Log Observer and Splunk Enterprise that will enable existing Splunk customers to leverage Splunk’s observability interface to explore and troubleshoot any logs stored in the Splunk platform, the company says. This will help customers centralize their log data in Splunk Enterprise and correlate metric and trace data with those logs, Splunk adds.
Another new feature in Splunk Enterprise is an auto-detect feature that will automatically discover anomalies in infrastructure log data, and then signal the user with an alert that appears on the dashboard. This was a feature requested by users, says Sean Bice, Splunk’s president of products and technology.
“Customers say….’I don’t have enough people on my team’ and they’re looking for the software to do more,” Bice said during a press conference Monday. “They need the software to be a little more intelligent. So in that context what they’re really talking about is like, hey if I’m using Splunk for observability, do you have the smarts? Could you do an auto detection of certain events? If you know the environment and you know the events, instead of me setting it up, how about you automatically set it up?”
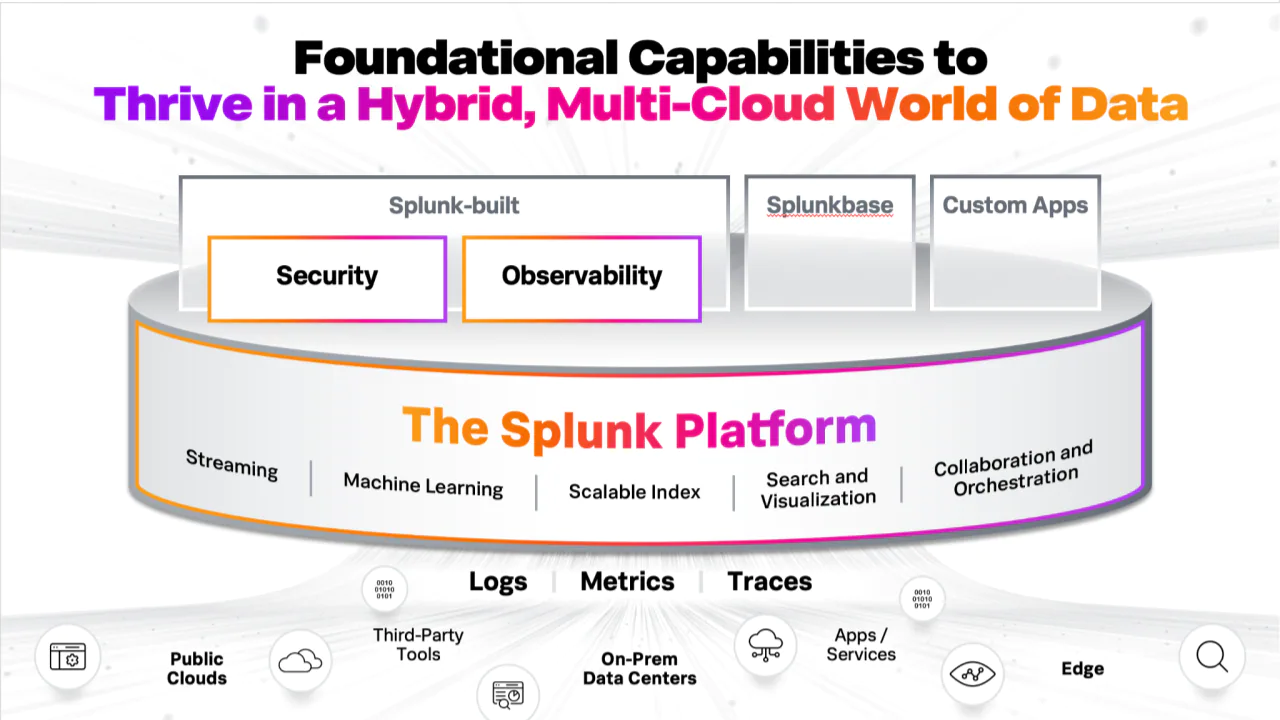
The Splunk Platform encompasses many different products and has many different entry points.
Splunk also announced new content for the Splunk App for Content Packs, which the company says is a “one-stop shop for prepackaged content, out-of-the-box searches, and dashboards for common IT infrastructure apps and services.” The new content packs support Microsoft365, third-party APM tools, and synthetic monitoring, the company says.
It is launching several enhancements to Splunk Cloud Platform, including a new Data Manager (currently in preview) that will allow users to do things with data before it gets indexed into the platform. Another new feature is Ingest Actions (also in preview) that will let users take action on data in motion, such as redacting, filtering, and routing the data to Splunk or to external AWS S3 storage.
These functions also were added at the request of users, Bice said. “Ingest Actions really comes from customers that have said ‘Look it would be great that, as I’m ingesting data, if I could apply smarts to it while it’s in motion. I would like to redact data or I’d like to do specific filtering,’” he said. “Or sometimes they’ll say things like, ‘You know what, I’ve got some data that I’d actually like to put on some less expensive storage. I don’t want to leave any data behind.’”
With so many different deployment options, Splunk customers sometimes have their hands full keeping everything working in a cohesive manner. To that end, Splunk today launched Federated Search, a new capability that allows users to search across all of their Splunk data, no matter what platform it’s actually running on.
Splunk also is making changes to how it charges Splunk Cloud customers. Its Flex Index (also in preview) will provide lower prices for customers who want to ingest, search, and store lower-value data that has longer retention periods and is used primarily for historic forensic investigation and compliance. It’s also launching SmartStore, which is now available as a preview on all three public clouds. SmartStore will enable customers to scale their Splunk environment “while controlling storage costs,” the company says.
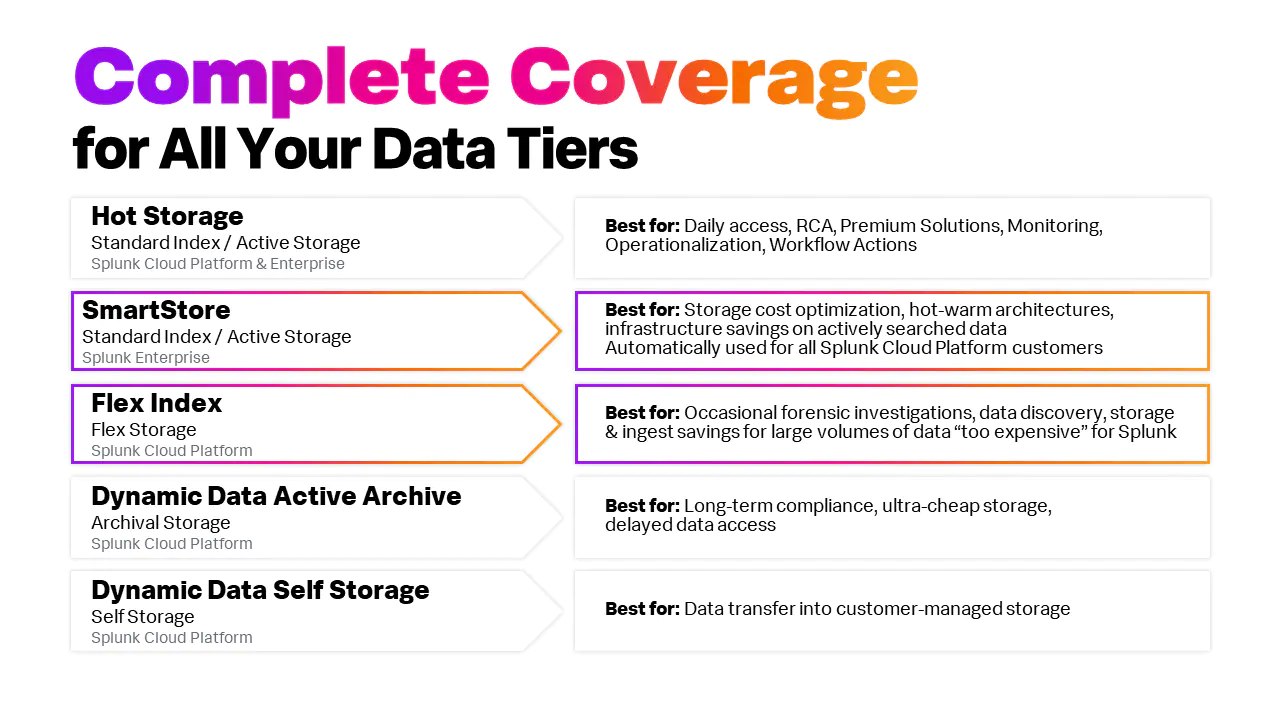
Splunk launched two new options to give customres more flexibility in pricing
The company also that the Splunk Dashboard Studio is now available on Splunk Mobile. It also announced that the Splunk Operator for Kubernetes is now generally available.
On the security front, Splunk made several announcements, including teasing the Splunk Security Cloud, which Splunk promises “is coming soon.” Splunk Security Cloud will deliver “access to new, rich visualizations that allow senior leaders to see key metrics and insights into the overall health of their organization’s security program.”
It also announced enhancements to its Splunk SOAR (security automation, orchestration, and response) offerings. The new Splunk SOAR App Editor provides a new way to edit, test, and create SOAR apps, and should boost integration with third-party tools, the company says. Finally, Splunk launched SURGe, which Splunk calls “an elite team of cybersecurity experts,” whose goal is to provide technical guidance to customers “during high-profile, time-sensitive cyberattacks.”
Related Items:
OpenTelemetry Gains Momentum as Observability Standard
Leading Solution Providers


Tabor Network
Sponsored Multimedia


Featured Events
-
AI & Big Data Expo North America 2024
 June 5 - June 6Santa Clara CA United States
 -
AI Hardware & Edge AI Summit Europe
 June 18 - June 19London United Kingdom
 -
AI Hardware & Edge AI Summit 2024
 September 10 - September 12San Jose CA United States
 -
CDAO Government 2024
 September 18 - September 19Washington DC United States