Beyond Dashboards: The Importance of Storytelling with Data

(anatoliy_gleb/Shutterstock)
Becoming a data-driven organization is more than just being able to measure the world and assigning figures to the phenomena we absorb. To truly benefit from the great progress we have made in data collection, storage, and analysis capabilities, we must be able to see beyond the numbers, comprehend the context, and convey the phenomena at a deeper level. In other words, we must improve in storytelling.
That’s the gist of a new report issued this week by Exasol. In “From the ‘what’ to the ‘why,’” the analytics database maker makes the case that organizations are floundering, to a certain extent, with their data analytics endeavors.
While we have the capability to process huge volumes of data, data alone isn’t enough to get us where we want to go. Instead of ever-bigger dashboards jampacked with tons of figures, what we need, Exasol says, is to focus on developing our data storytelling skills.
For the report, Exasol surveyed 500 business leaders and data professionals at American companies with more than 1,000 employees. The results indicate that, while data analytics and business intelligence capabilities are widespread, they’re not delivering the full value that users hoped they would.
For example, 82% of the people who Exasol surveyed said that they regularly used dashboards to share insights gleaned from data. However, the dashboards are coming up short in a couple of key areas.
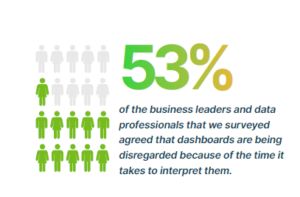
For starters, there’s too much data in the dashboards. Exasol found that 53% of the folks it surveyed “agreed that dashboards are being disregarded because of the time it takes to interpret them,” the company says.
“Second, and perhaps most importantly, these dashboards fail to convey the most important piece of information that businesses need in order to act on data insights–the ‘why,’” Exasol continues in the report.
Among that 53% cohort who said dashboards were being disregarded, 61% said that “lack of context” was the biggest downside to dashboards, while 54% said the dashboards are “trying to communicate too much.”
For example, a dashboard can easily show a retailer that sales decreased by 10% last month. There’s any number of chart types that communicate this reality. But the more important question for an executive at the retailer is why. Why did sales drop last month? With more clues about the possible causes, the executive will be better positioned to impact the organization, and get sales growing again.
The solution, in Exasol’s view, is the need for a greater focus on data storytelling, as well as data literacy. Just what is data storytelling? The Data Warehousing Institute (TDWI) defines it as “The practice of building a narrative around a set of data and its accompanying visualizations to help convey the meaning of that data in a powerful and compelling fashion,” according to Exasol’s report.
The good news is that 82% of IT and data decision makers are already familiar with the concept of data storytelling, according to Exasol. What’s more, 71% of those surveyed agreed that data storytelling skills are “very important when reporting results to the C-suite or other key stakeholders,” the company writes in its report.
“Data storytelling bridges the gap between obtaining insights and interpreting them,” says Exasol Chief Data and Analytics Officer Peter Jackson in the intro to the report. “Having the technical knowledge and advanced data science skills is important, but so is being able to interpret that for the rest of the stakeholders.”
While the vast majority of business and IT leaders are aware of data storytelling, not everybody is actually using it. According to Exasol’s survey, a quarter of the folks it surveyed are aware of storytelling as a concept, but do not use it at their organization.
Exasol sees data storytelling as a core component of data literacy. However, 49% of the folks it surveyed said their organizations lack storytelling skills, “irrespective of whether employees are data literate or not.” A similar percentage (48%) said that non-data literate people won’t be able to understand the data stories, the company found.
Exasol sees education as the answer to improving not only data literacy, but storytelling abilities as well. By focusing on both skills, organizations can enrich their data culture and have employees who are better able to “interpret complex information on their own, act on their findings, and then tell their own data stories,” the company says.
“This research illustrates the business value that comes from being able to effectively communicate data insights to everyone within an organization–not just data or IT professionals” Jackson says. “Data storytelling is a universal language that everyone can understand–from people in STEM to arts and psychology.”
You can access a copy of the report here.
Related Items:
Achieving Data Literacy: Businesses Must First Learn New ABCs
The Storytelling Mandate of Big Data
A Storyboard Approach to Big Data Insights


