

April 26, 2021
Graph Analytics Powers Insights in Financial Services
(Jirsak/Shutterstock)
When a new technology emerges, financial services firms often are among the first adopters. Anything that can provide banks, investment houses, or insurance companies a competitive edge is given a shot. So it’s not surprising to see that graph databases and graph analytics are starting to flourish in financial services.
Graph database provider TigerGraph held its annual Graph + AI Summit last week, and several of its customers and partners in the financial services shared their experiences with the database and graph analytics and AI in general.
Among the presenters was Bradford T Spiers, an executive director with JPMorgan Chase. According to Spiers, JPMorgan Chase has just a bit of data–450 petabytes of it, to be exact. While that would be far too much data to load into a graph database, Spiers assures us that graph is a promising tech for the 200-year-old company.
“We’re in the midst of a truly one-of-a-kind journey,” Spiers said last week during his presentation at Graph + AI Summit. “We are looking to leverage graphs to understand and predict network-based insights. We then feed these insights into advance machine learning algorithms, which then produce better machine learning models, which in turn make better business decisions.”
Spiers didn’t spell out exactly how JPMorgan Chase was using TigerGraph or graph technology. Getting the biggest firms in the world to talk about their special sauce is notoriously difficult to do. But in general, it’s sufficient to know that the company is using graphs to gain greater insight into its clients and their transactions.
“We like to think of graph as enabling us to be at least one step ahead,” Speirs said. “At a high level, graphs clarify relationships. Others might say that they provide more nuanced insights. Put simply, relying on entire paths or sets of relationships in a graph, can provide deeper insights that just looking at nearest neighbors, which is what a typical database would afford you.”

Users can move from the “hairball” stage of graph analytics to real business outcomes, says JPMorgan Chase’s Spiers
JPMorgan Chase is using TigerGraph to solve “Six Degrees of Kevin Bacon” type of challenges, Spiers said. “You think, OK, if I want to find the shortest path, a Kevin Bacon connection between me and someone else, we’re actually running the shortest-path algorithm,” he said. “But Kevin Bacon’s statement–six degrees of separation–also describes some of the challenges. What that says is, if my path is only six hops long, I might need to explore the entire graph.”
With a company the size of JPMogan Chase–52 million customers, $6 trillion in payments processed everyday–the “entire graph” can quickly become a “giant hairball.” That’s the phrase that Spiers used to describe what graph representation of data actually look like.
“What can happen as graphs grow?” Spiers asked. “As you try to analyze, as I call it, the hairball, I want you to remember two things. The first is the Kevin Bacon problem I talked about. Graph problems, many of them, are combinatorial. What that means in practical terms is it can grow very quickly. You can very quickly go from getting consistent answers according to some service level agreement that your business needs, to getting no answer.”
Different graph database platforms have different scalability characteristics. In fact, there can be a 100x difference in performance of graph database performance, Speirs said. “The platform choices really matter,” he said.
As you start to pull apart the data “hairball,” interesting patterns will start to appear. More questions will start coming, and the data scientists will be excited to help the company make better business decisions.
“That group will definitely drive distinctive business outcomes. What happens next?” Spiers said. “You want to begin with the end in mind. What will happen is that people will come with more data, and they will ask more difficult questions. They might start with a Kevin Bacon-style question, but they’re going to get to more complex things, things like sub-graph isomorphisms, things where you can look for patterns in your [data] that would allow you to differentiate in each context.”
Intuiting Graph
Graph is also providing to be critical to helping Intuit to detect fraud within its financial services platform. Specifically, it uses insights from a TigerGraph-based graph database that tracks entities to generate features that are utilized by a machine learning-powered fraud detection system.
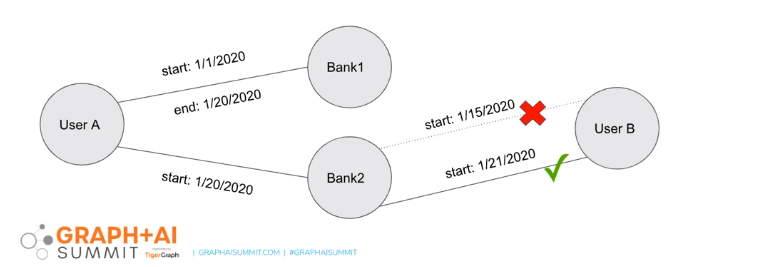
Intuit keeps track of the start and end date for every node in its graph
There were two main challenges that the company had to overcome to build this system, Uri Lapidot, a senior product manager with Intuit, said during his presentation at Graph + AI Summit.
For starters, Intuit was reluctant to learn GSQL, the graph query language that TigerGraph uses in its platform. “Tis not a very complicated language to learn,” Lapidot said, “but also not a very common one.”
The company overcame this challenge by adopting an abstraction layer that allowed Intuit’s data scientists to submit queries to TigerGraph using GraphQL, which is a more commonly used query language. The abstraction layer generates the required GSQL code, eliminating the need for them to learn GSQL.
The second challenge was technically more difficult: how do you generate historical features about graph relations to use as training data for the ML fraud-detection system?
“In order to calculate graph feature’s historical value, we need to know what was the relationships between any two entities on the graph at a given point in time in history,” Lapidot said. “This is almost like developing a time machine.”
The company pondered several ways to solve the problem. Should they keep a log full of all changes to the graph database? Or perhaps it should pre-calculate all features and store their values for later use?
The solution that it finally came up with was more elegant and easier to implement (“Well, at least easier than building a time machine,” Lapidot said): the company decided to implement a start date and an end date for any edge stored in the graph. That way, it could infer if there was a connection between any two given entities at any given point in time.
As a result of using graph-based features to train the ML fraud system, the company increased the amount of fraud it was detecting by 50%. It also improved the accuracy of ML model predictions by 50%, Lapidot said. “For us, this a game-changing technology that we plan to leverage more and more in the future,” he said.
AML and Fraud
According to Accenture’s Heather Adams, governments, public safety organizations, and corporations are all moving toward adopting more sophisticated techniques to identify fraud and financial crime, and violations of sanctions.
“Society now expects such organizations to use the data available by public registry, data providers, and the media in their decision making as to who to do business with,” she says. “Detecting fraud and financial crime is not just a legal compliance exercise–it’s about playing a meaningful role in society in preventing terrorist financing, and stopping criminal gains from activities like drugs and human trafficking.”
Adding more sources of data to one’s analysis improves the odds of finding fraud and financial crimes, Adams says, while modern analytics and AI can help automate the detection of those crimes. “[Taking a] data-driven approach typically reduce manual effort and analytics reduce the volume of alerts requiring investigation,” she says.
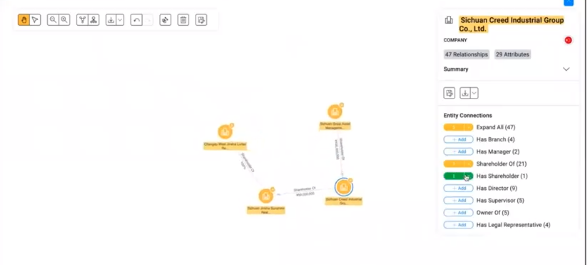
Sayari Labs uses TigerGraph’s database to help users find ultimate beneficial owners (UBOs)
Farley Meskko, the CEO of Sayari Labs, provided a compelling example of how graphs can significantly streamline the process of determining ultimate beneficial ownership, or UBO, as part of an anti-money laundering (AML) or know your customer (KYC) investigation
“This is a relatively new regulatory requirement that compels bank to identify the real people who own and control the companies that use that bank,” Meskko says. “No matter how many layer of ownership or shell companies those people might use, the bank has to figure out who is the real person beyond the shell companies in Panama or the Cayman Islands who owns a corporate entity in New York or London who is the direct customer of the bank.”
Graph database are perfectly designed to answer this UBO question, because of the way they store data, as the connections (or edges) among entities (or nodes), Meskko says. However, graph database historically have struggled to function at the scale that financial institutions need them to work.
Meskko says TigerGraph is ideal for solving UBO challenges because it can “simply handle more data.” His company currently has 700 million relationships (or edges) across nearly 1 billion entities (or nodes) stored in a TigerGraph database.
“For beneficial ownership, we often see ownership hieracia that are six or seven or more layers deep, especially in places like China, places with large state-owned enterprise,” he says. “You have a to have a graph [database] that can handle traversals and queries at least six or seven layers deep, if not more, in order to truly answer these questions, and TigerGraph does a great job of that.”
TigerGraph can not only handle those the massive queries that touch a large number of nodes, but it can provide the answer within seconds. “That’s critically important if you’re trying to run analytics for AML/KYC in near real time.”
Insurance Claims
Graph and AI is also being adopted in the insurance business. Infinilytics develops a platform called Charlee that uses a variety of graph, NLP, AI, and sematic search techniques to bolster claims processing. The graph component is based on TigerGraph’s graph database.

Infinilytics’ platform, Charlee, uses graph and AI techniques to make sense of unstructured data
“We’ve come up with a way to look at the unstructured text in claim files,” says John Standish, the co-founder and chief innovation officer at Infinilytics. “In a claim or underwriting file, 70% to 80% of the information is what we call unstructured text.”
That unstructured text could be claim notes, emails, outside reports from attorneys or medical providers, or data from third-party sources such as the National Insurance Crime Bureau. When a claim is filed, the underwriters or claims examiners spend more than 70% of their time gathering information, which is staggering, Standish says.
“We use AI, machine learning, NLP, and semantic search analytics…to bring these insights out quickly and efficiently, so the claims examiner and everyone else that’s involved with that claim can make a better, more informed decision, and have confidence in their decisions.”
Related Items:
TigerGraph Roars with $105 Million Round
Finding and Managing Super Analysts for the Fourth Industrial Revolution
How Banks Can Compete in a Data-Driven Future
Sectors:
Financial Services
Leading Solution Providers


Tabor Network
Sponsored Multimedia


Featured Events
-
Call & Contact Center Expo
 April 24 - April 25Las Vegas NV United States
 -
AI & Big Data Expo North America 2024
 June 5 - June 6Santa Clara CA United States
 -
AI Hardware & Edge AI Summit 2024
 September 10 - September 12San Jose CA United States
 -
CDAO Government 2024
 September 18 - September 19Washington DC United States