

February 17, 2021
Grafana Labs Upgrades Observability Platform

Source: Grafana Labs
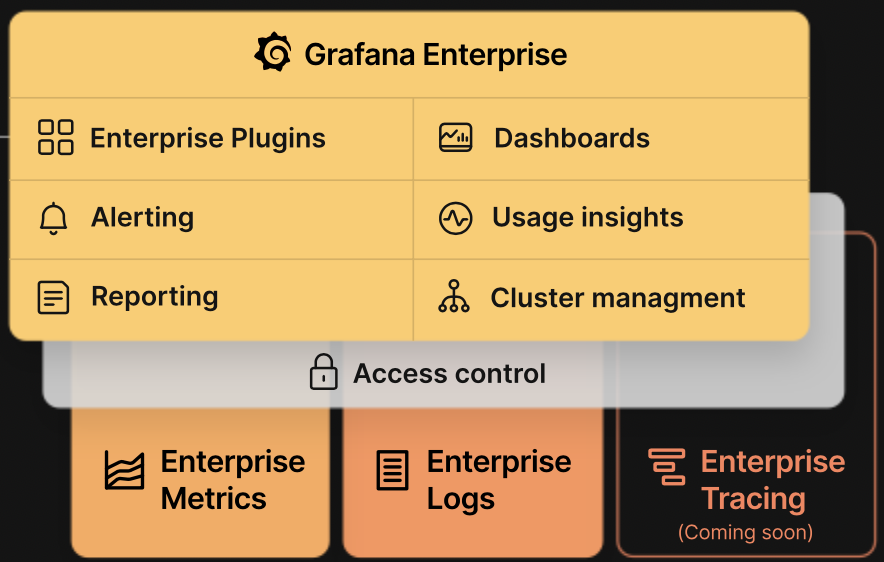
Grafana Labs’ new enterprise stack released this week incorporates a metrics service for Prometheus, the machine data storage and monitoring platform for cloud-native deployments, along with a log aggregation tool based on Grafana Loki.
Patterned on Loki’s log indexing framework, the company said Wednesday (Feb. 17) its enterprise Logs offering enables scaling along with the resulting cost savings.
The self-hosted enterprise stack adds observability features and includes data sources for other commercial tools ranging from MongoDB (NASDAQ: MDB) and Splunk (NASDAQ: SPLK) to New Relic (NYSE: NEWR), Oracle (NYSE: ORCL) and Snowflake (NYSE: SNOW). Along with Loki, new observability features include a metrics service based on Prometheus, which in turn is built on the Cortex open source monitoring system launched last year by Grafana Labs.
Meanwhile, the New York-based developer of open source tools for visualizing logs and metrics said it enterprise option also provides a log aggregation capability.
Other new Logs features include and instance management plugin for visually building and managing instances along with access policies and security tokens. The plugin can be used to create new data sources or view system configurations, the company said.
The enterprise stack also controls access by making it easier for administrators to distribute and limit access to specific logs and users across large companies.
Enterprise security features include built-in access policies and tokens.
The release of the enterprise stack follows a flurry of releases in the wake of Grafana Labs’ recent cloud partnership with Amazon Web Services (NASDAQ: AMZN) centered on the Prometheus monitoring platform. The platform can be used as an observability stack that also tracks logs and traces.
Last month, the open source tool developer released a free cloud tier for monitoring Prometheus along with Graphite for metrics, Loki for logs and Grafana Labs’ new tracing tool, Tempo. The company promotes its monitoring tools as managed by the maintainers of popular open source projects.
Tempo is available now. An enterprise tracing tool will be available soon, Grafana Labs said.
Recent items:
Grafana Pushes Open Source to the Cloud
AWS Launches Managed Services for Grafana, Prometheus
Source: Grafana Labs
Applications:
Enterprise Analytics
Vendors:
Grafana Labs
Leading Solution Providers


Tabor Network
Sponsored Multimedia


Featured Events
-
Call & Contact Center Expo
 April 24 - April 25Las Vegas NV United States
 -
AI & Big Data Expo North America 2024
 June 5 - June 6Santa Clara CA United States
 -
AI Hardware & Edge AI Summit 2024
 September 10 - September 12San Jose CA United States
 -
CDAO Government 2024
 September 18 - September 19Washington DC United States