

May 18, 2020
Sisu Seeks to Answer Why

(microstock3D/Shutterstock)
In a typical business, analysts are tasked with using data to finding answers to questions. They’ll often use a BI tool to explore and query data stored in analytical database to figure out why something happened. Despite having the latest tech, analysts are struggling to find answers buried among a huge number of variables. But now a startup that emerged from the Stanford University’s DAWN project named Sisu is helping to automate that search for answers.
We’re living in an environment that’s rich with data but short on actionable information, according to Peter Bailis, the co-principal investigator of the Stanford DAWN project and founder and CEO of Sisu.
“What we noticed, even with some of the cutting-edge FANG-scale companies, was even with massive analytics teams and data science teams, these folks are using essentially a decreasing amount of data over time,” Bailis says. “There’s more and more data available, but the actual amount of data being utilized is going down.”
We are storing ever-bigger sets of data in powerful cloud databases like Snowflake, AWS Redshift, and Google Cloud BigQuery, and have compelling analytics tools from vendors like Tableau, Looker, and Qlik to slice and dice data to our heart’s content, Bailis points out. But for some reason, the result is not what we expected: a proliferation of actionable insight emanating from the data.
“There’s a sort of disconnect between the structured data available inside of an enterprise, and what it takes to actually get value out of this data,” Bailis observes. This is true not only in the Fortune 500 companies that have been bitten by the data bug, but also among the FANG firms – the Facebooks, Apples, Amazons, Netflixs, and Googles of the world – who presumably are better at big data.![]()
Bailis, who is an assistant professor of computer science at Stanford University, led research into this question at the Stanford DAWN project.
A New DAWN for Data?
“A lot of the research in my group, what became Sisu, was geared around the discussion around how do we help people who define metrics and dashboard and are tracking key metrics like engagement, conversion, margin, spend, and so on, on top of all the data – how do we help them use more of that data and be more productive with it,” Bailis tells Datanami in an interview.
“What we found was, in many cases, the challenge went from not just understanding what’s going on – any BI tool or environment can do that,” he continues. “When you have this super wide data that, all of these different features and columns and so on, essentially understanding why the metrics are changing” is the challenging part.
Every piece of data that we’re collecting has more context today, more features that describes customer behavior (or whatever is being tracked). Those features directly translate to more columns in the analytic database.
In some cases, companies are tracking hundreds of features across hundreds of columns. On the one hand, this is great, since we can now create fine-grained metrics and dashboards to track all sorts of behaviors and phenomenon. On the other hand, it creates a problem when business analyst are asked to drill down and isolate the root cause driving a change in metrics. The root cause is important to know, of course, because it tells the company how they can act upon it.

Peter Bailis is the founder and CEO of Sisu and co-principal investigator of the Stanford DAWN project
This “combinatorial explosion” of variables is severely limiting the ability of analysts to do their jobs efficiently, Bailis explains.
“All that work I’m putting into data engineering and pulling in more columns and pulling in more features. But unless my analysts…or performance marketing folks are digging in and slicing and dicing by every single feature and column in these data sets, that data basically goes under utilized,” he says.
“If you knew the right SQL query to run, it would be easy,” he continues. “But there’s so many possible possibilities.”
Sisu As Tool
Bailis and his team attacked the problem by developing a new data processing engine, which would ultimately became Sisu, to accelerate the ability of analysts to answer the question “Why are my metrics changing?” using all of the wide data available inside of a typical enterprise.
The engine they developed uses statistical and machine learning techniques to surface superior answers to questions posed by analysts. It does this by automatically analyzing many of the possible variables or combination of variables that are at play for a given query.
The Sisu engine sits next to the analytical database, and the first step is to load the data into Sisu. Once the data is loaded, is continues to generate answers based on the latest data entering the analytical database. Customers then tell Sisu what question they want to ask.
“You declare the metric. You tell us the attributes. We’ll go and do the slicing,” Bailis says. “It’s essentially geared at running very large hypothesis tests, statistical tests, to understand what variables are interesting and important, and then how are ways in which you can transform those variables.”
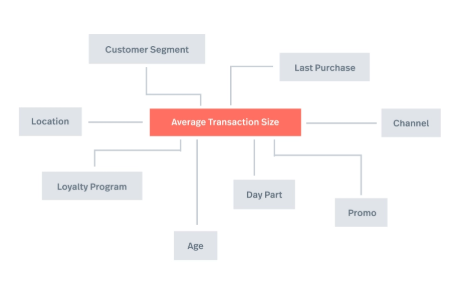
Sisu uses statistical techniques to find the underlying variables driving changes in key business metrics
From a data perspective, Sisu works much like a giant OLAP cube that allows users to slice and dice the data from multiple angles and dimensions. Sisu gives users this benefit, but without actually materializing the cube, because taking that naïve approach would be too slow, Bailis says.
“You can think of it like a search space that we’re going through,” he says. “It’s almost an iterative computation under the hood, where basically we’ll continue to identify promising regions of the search space, based on what was previously materialized, and then we’ll cut out other regions, based on certain other statistical inequalities.”
Sisu, which was written in Rust, also contains a dataflow engine that helps to parallelize the computations. “Because we’re doing a lot of these irregular group-bys, we basically have a columnar MPP primarily memory-based parallel dataflow engine, which basically does smart data encoding and a bunch of …parallelization and so on, which makes us from a hardware perspective, also fast.”
Sisu in Action
Sisu is similar in some respect to Spark, developed by his fellow principal investigator at Stanford DAWN, Matei Zaharia.
“You can think of it kind of like the Spark processing model, where instead of Spark you’ve got Sisu, which is basically doing the heavily lifting of compute,” Bailis says. “Unlike Spark, Sisu is not a general purpose programming environment. We’re basically a point and click tool accessible by data analysts.”
The primary users for Sisu are business analysts who would normally be running ad hoc queries in a BI tool in support of their businesses. However, not every type of company can actually act upon, or monetize, answers at the pace that Sisu can provide them. For that reason, it’s primarily used by folks in marketing, operations, and financial services.![]()
“You point Sisu at your [data] warehouse, define your metrics, highlight the attributes you care about tracking, and then we’ll give you in real time the factors and top drivers behind each metric you’ve provided,” Bailis says. “Then as new data arrives, we’ll continuously process the data and actually allow users to subscribe to notifications about their metrics.”
Bailis started developing Sisu (the product) in 2015, and in 2018 the product was officially launched by Sisu (the company). It shares the same board as Databricks, and has raised $66.7 million to date.
Some of Sisu’s early customers include Samsung, which uses Sisu to more analyze attributes of buyers of its mobile phones. Microsoft also used Sisu to analyze data collected about Skype users. It’s also been used by Facebook, and other companies that have not given the okay to user their names. Most of Sisu’s customers today are in the cloud, which is where many companies are building their data infrastructure, but it’s not a requirement.
Sisu has the advantage of building a marketshare in a product category that it largely invented itself. To that end, it’s competition is primarily the millions of business analysts who toil away in BI tools, seeking data-driven answers to an endlessly growing list of questions.
“It’s not like there’s any other tool that does exactly what we’re doing,” Bailis says. “We’re basically taking analyst work and making it more efficient. Analyst sometimes say, ‘Gosh is it going to replace my job?’ The short answer to that question is another question: How long is your queue of work that your business is asking you to do?
“There’s not enough questions that get answered in the first place,” he continues. “Let’s automate the routine and repetitive slicing and dicing that goes into the root cause analysis for these analysts. Let’s make it proactive so those analysts look even smarter. and then let’s let the analyst do the creative work of defining the KPIs, going deeper in certain analyses, and really telling that story about what’s going with these metrics.”
Related Items:
Op Analytics Tool Tracks Metrics in Real Time
Training Your AI With As Little Manually Labeled Data As Possible
When Big Data Becomes Too Much Data
Applications:
Data Mining
Leading Solution Providers


Tabor Network
Sponsored Multimedia


Featured Events
-
Call & Contact Center Expo
 April 24 - April 25Las Vegas NV United States
 -
AI & Big Data Expo North America 2024
 June 5 - June 6Santa Clara CA United States
 -
AI Hardware & Edge AI Summit 2024
 September 10 - September 12San Jose CA United States
 -
CDAO Government 2024
 September 18 - September 19Washington DC United States