

March 27, 2019
When Citizen Data Science Meets Basketball Analytics

Basketball, like all sports these days, is getting more data-driven all the time. Teams are looking to data to tell them where to play, what to shoot, and who to double-team in the hopes of eking out a competitive edge. While much of the basketball analytics is hush-hush, the citizen data scientist still has opportunities to glean insights from data that is readily available.
One such citizen data scientist is Nick David, a product management specialist at Datawatch, which was recently acquired by data engineering and HPC software developer Altair. David isn’t classically trained as a data scientist, but he does have data analytic skills. What’s important, though, is he knows basketball.
“I decided I wanted to build a model that allowed me to predict something that’s a fun debate among fans: Who’s going to make the NBA All-Star team?” David said. “I started looking at this back in November. I wanted to see if I could pull enough statistics to build a model to predict who is actually going to end up making it.”
The All-Star team selection process is a relatively democratic process that involves several voting buckets, including ballots for fans, for players, and the media. The NBA’s goal, ostensibly, is to select “the best” players from each conference, East and West, which could include some fan favorites. David’s goal was a little bit different, in that he took a pure statistical approach to identify superior play.
His first challenge was gathering historical player data and exploring it to see what it could tell him. He scrounged about the Web and managed to obtain a data set that included the historical performance data for individual players going back to 1997 in CSV format. He also had team-level statistical data, which would also be used in his model.
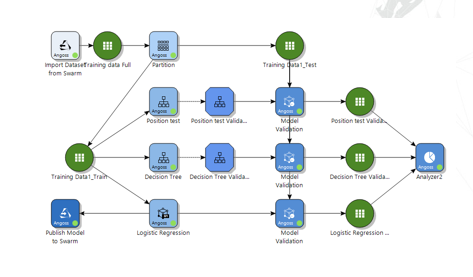
A decision tree was used for Nick David’s first attempt to statistically model the All-Star team selection process (image courtesy Monarch)
Next David started thinking about which statistical categories he would feed into his predictive model. There were some offensive categories that were no-brainers to include, like the average number of points, rebounds, and assists a player has per game, which have obvious correlations to All-Star success.
“I started using exploratory tools available to me within Altair Knowledge Studio,” David tells Datanami. “I was able to it down to a point where I was pretty happy with a core set of 10 to 12 potential variables that I would be using. And as I stared to apply models, I’d be able to narrow that down to exactly what I wanted to use.”
David looked beyond the pure offensive numbers to find other indicators of All-Star success, including fouls, turnovers, and the position a player plays, but had mixed results. It turned out fouls was not simply a good predictor of whether an NBA player would make the All-Star team. Defensive statistics are especially hard to come by, and remain the subject of much secrecy by the teams that have developed advanced metrics. (NBA teams do, it turns out, play defense, although it might not be obvious to the casual fan.)
Interestingly, David found turnovers to be a good predictor, as a proxy of sorts for something more positive. “The reason for that is only the best players are allowed to handle the ball enough where they’re turning it over that much and not getting benched,” he said. “If you are turning it over that much it means you’re carrying a heavier load for the offense and subsequently are more likely to be contributing in other ways.”
Next, David started building his predictive model. He looked at the algorithms available to him in the Datawatch product line, and decided to try a decision tree first. As a citizen data scientist, he figured a decision tree would provide him with stabilizing guiderails as he fine-tuned the model.
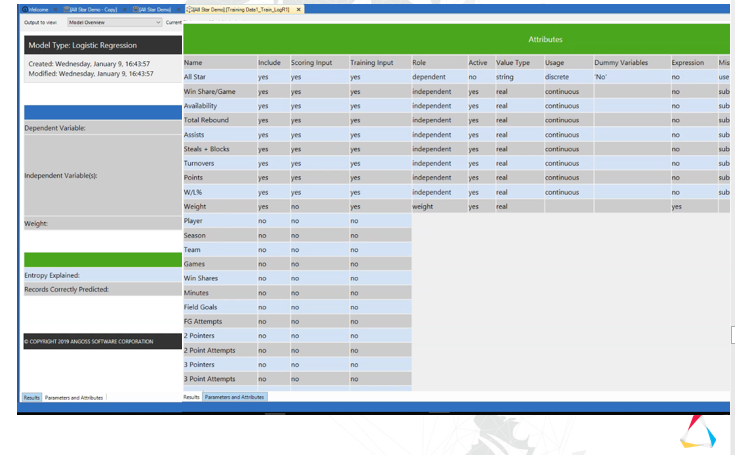
When the decision tree failed to recognize Steph Curry’s 2014-2015 greatness, David looked to a logistic regression algorithm (image courtesy Monarch)
“A decision tree in this case is good for somebody who’s net necessarily familiar with data science, because it provides a strong visible component that lets you see how that model is making its decision,” he says. “And if you follow a series of nodes based on different variables and different decision points, ultimately you will land on a probability.”
However, when the decision tree started making some odd predictions, he wondered if perhaps it was not the best choice for this particular project. One predictive anomaly that stood out to David was how the model handled Gold State Warriors guard Seth Curry’s breakout 2014-2015 season, in which he was named the Most Valuable Player.
As the MVP, Curry should have been a 100% lock to make the All-Star team that year, but the decision tree didn’t think so. “The reason for that was, because his season was so historic, it actually didn’t have a strong precedent for it to follow a different path down the decision tree,” he says. “And that led me to have a conversation with one of my colleagues [who’s a data scientist], and he recommended that I use a logistic regression.
“The logistic regression was much better suited for tracking things that have a lot of variables involving counting statistics, such as player stats, David said. He redesigned the model around that algorithm and adjusted it until it was generating what looked like good results. Then he validated the model against the 20% of data that he had withheld (the 80% chunk was used to train the model).
Finally he began to use the model to begin scoring players in the 2018-2019 season. As the season progressed, he monitored the how his model tracked player performance using a dashboard that he developed using the Datawatch suite of tools.
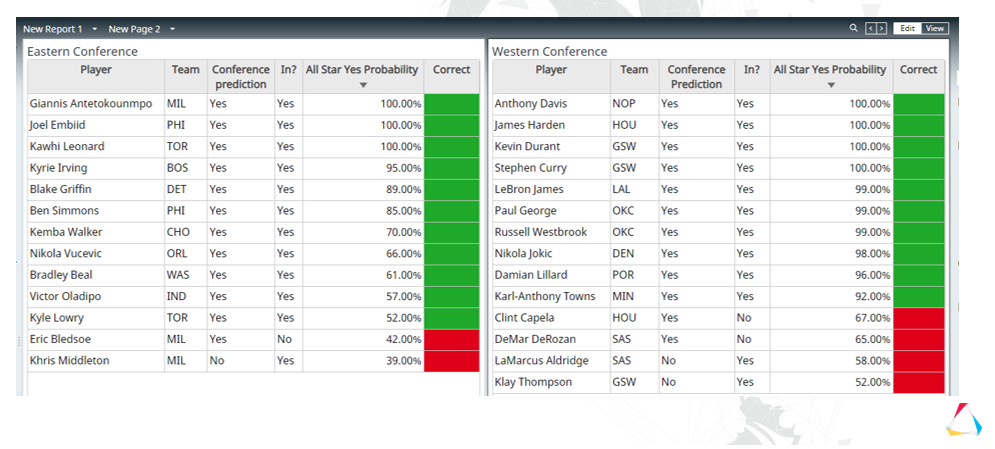
Ultimately, David’s system correctly predicted 21 of the 24 players on the two NBA All-Star teams (image courtesy Monarch)
The model worked very well, David says. “Each player had peaks and valleys in season, where they slumped and then went on hot streak, and I watched the numbers jump around,” he said.
When it was finally time to announce the All-Star team, David consulted the dashboard one more time to see how it ranked the players according to a weighted average of their combined, the model had correctly predicted 21 out of 24 total spots.
Afterwards, David sat down with his data scientist colleague to discuss what they had learned, and they concluded that the model actually held up pretty well against the validation techniques that a full-blown data scientist would have applied. While it didn’t go through the same level of statistical rigor that a data scientist would have applied, it demonstrated the value of enabling non-data scientists to work at a high level in the field.
“Depending on the nature of the problem you’re trying to solve, sometimes you do want a data scientist on it. For some problems, sometimes, you need that level of precision,” he said. “But to be able to split out some of the workloads and allow a few more people to be able to fend for themselves” shows what a big win it can be for the organization.
Related Items:
It’s March, Time For Bracket Analytics
Three Ways Analytics Impacts the NFL
Deep Learning Is About to Revolutionize Sports Analytics. Here’s How
Leading Solution Providers


Tabor Network
Sponsored Multimedia


Featured Events
-
Call & Contact Center Expo
 April 24 - April 25Las Vegas NV United States
 -
AI & Big Data Expo North America 2024
 June 5 - June 6Santa Clara CA United States
 -
AI Hardware & Edge AI Summit 2024
 September 10 - September 12San Jose CA United States
 -
CDAO Government 2024
 September 18 - September 19Washington DC United States