

May 25, 2018
MLB Unravels Home Run Mystery with Analytics, Modeling and Simulation

(Eric Broder Van Dyke/Shutterstock)
Since the 2015 season, the ball has been flying out of Major League ballparks at a remarkable clip. While people had ideas about what caused the surge, nobody knew for sure. But now an in-depth analysis of hitting data and computer simulations are finally shining some light on the matter.
To get to the bottom of the mystery, Major League Baseball commissioned a group of nine professors from top universities around the country and one baseball stats expert to explore possible explanations. The results are on display in an 84-page report that was released yesterday.
The authors of the report looked into all aspects of the home run spike. They crunched the data, built computer models, visited Rawlings baseball factory in Costa Rica, and even tested the aerodynamic characteristics of balls in a sports lab in Washington state. After exhaustive analysis, the authors are confident they’ve isolated the most likely cause of the mysterious increase in home runs over the past three seasons: a significant decrease in the drag coefficient of the ball itself. However, they’re not sure what’s causing the decrease.
Before arriving at that conclusion, the authors first described what’s been occurring in Major League ballparks. The authors determined that there has been “a dramatic increase in home run hitting the past three seasons” compared to the records going back to 1960. What’s more, the 2017 rate of 0.048 home runs per batted balls is an all-time high, surpassing even the home run surge that occurred at the height of the game’s “Steroid Era” in the late 1990s and early 2000s.
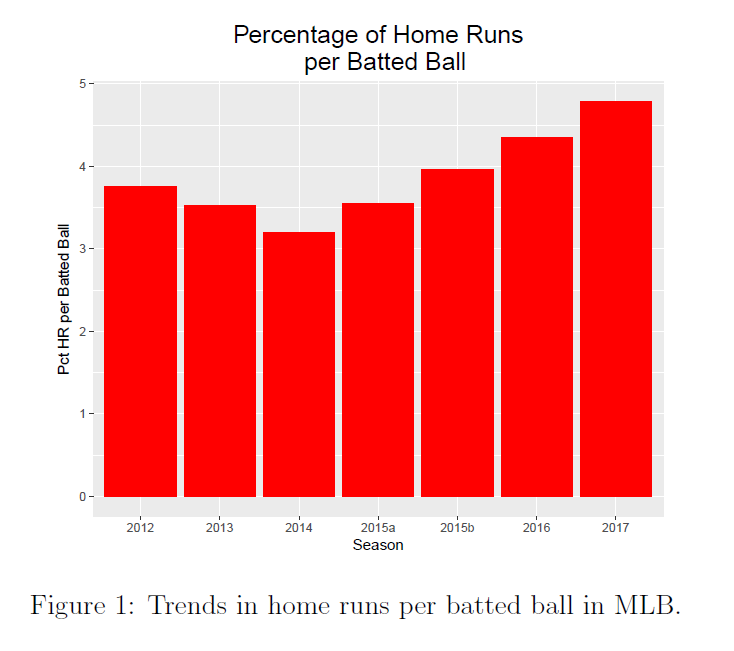
Home runs have increased substantially in each of the past four seasons (Source: MLB report)
The authors took pains to isolate various factors at play in an effort to come up with a meaningful theory for what’s causing the surge. They theorized that a small cluster of talented hitters could have been bending the curve, but that didn’t pan out, as the increase in home runs was “global” across hitters of all types, the authors found. They looked at whether changes in temperature were a factor, since it’s well-known that baseballs carry further in hotter, drier air, but they found no evidence that was the case (although the April 2015 directive from the MLB office for all teams to store balls in a temperature- and humidity controlled state stands out.)
Ballparks are another variable they sought to isolate, but once again the authors could not find any meaningful correlations, as home runs have been increasing steadily in all 30 MLB ballparks. Likewise, pitch selection has remained relatively constant, and the authors didn’t detect any correlation to the eight different pitch types (fastball, cutter, split-fingered fastball, slider, sinker, curveball, change-up, and knuckleball) and home runs. “The home run surge has not been attenuated by adjustments in pitching strategy,” they wrote.
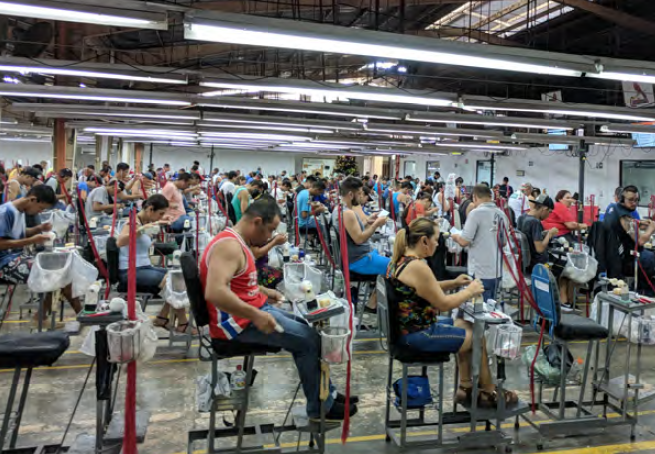
Rawlings’ largely manual manufacturing process has not changed much in the recent past (Source: MLB report)
MLB’s investigators even visited Rawlings’ manufacturing facility in Turrialba, Costa Rica, to see if anything was being done dramatically differently. While the company has changed the equipment it uses – mostly to replace aging tools or to make small process improvements – laboratory testing on balls going back to 2012 indicate no substantial changes on the performance characteristics of the balls.
The authors’ lab work – conducted at the Washington State University’s Sports Science Laboratory — found there are, indeed, year-to-year variations in the size and weight of balls, as well as in the coefficient of restitution (COR), which measures the dynamic performance of a baseball travelling at 60 mph against a flat surface, and the cylindrical coefficient of restitution (CCOR), which measures the dynamic performance of a baseball travelling at 120 mph against something shaped like a bat.
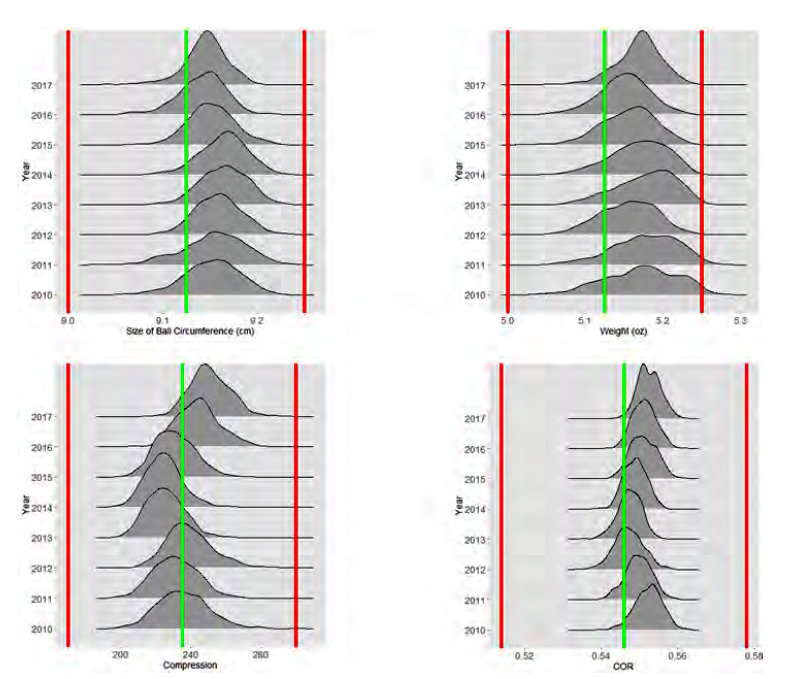
The size, weight, compression, and COR of Rawlings’ balls vary from year to year, but the changes are within MLB’s specifications and don’t correlate well with observations (Source: MLB report)
However, the variations are all within MLB specifications. In fact, the Rawlings balls are consistently much closer to the target spec that MLB sets, and are consistently well within the allowable variances on a year-to-year basis. For this reason, the authors recommended that MLB tighten up its specs, which some critics have seized upon to back up their “juiced ball” theory.
Finally, a big clue emerged when the authors analyzed actual game data from batted balls. The authors first looked at StatCast data that measured exit velocity, launch angle, direction, spin rate, spin axis, outcome, and distance. The authors found that when they held the exit velocity and launch angle as constants from 2015 to 2017, that the inferred distance of the batted balls nevertheless increased.
“The increase in distance from 2016 to 2017 can be as large as five feet for exit velocities near 102 mph and launch angles near 29 degrees,” the authors wrote. “This increased distance in batted balls is consistent with the increase in the home runs in the last two seasons.”
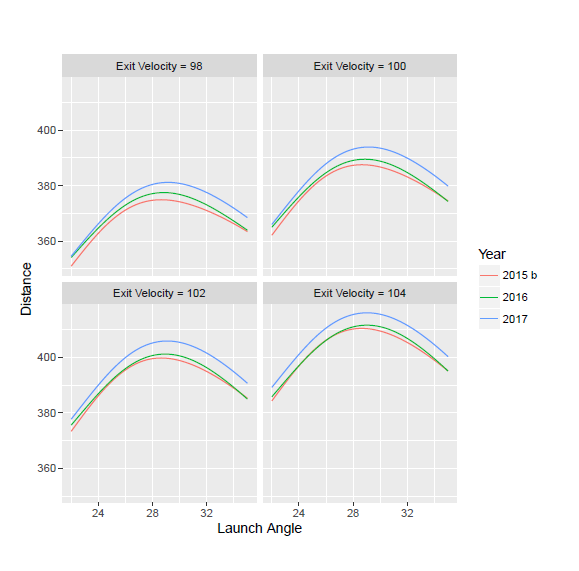
The distance that balls fly has increased despite no changes in launch angle and exit velocity, the MLB report found (Source: MLB report)
To better visualize the data, the authors created a spatial map for the 2016 and 2017 seasons that compared the probability of a home run as a function of the launch angle, exit velocity, and spray angle, or the degrees away from dead center field that the ball was hit. The map showed a broad zone where the odds of similarly hit balls going over the fence increased from 2016 to 2017. “This figure confirms the earlier evidence that the home run probability in the redzone has significantly increased for the 2017 season,” the authors write.
Aerodynamic testing conducted at Washington State University was also conducted. The investigators used a linear accelerator (a regular wheel-based pitching machine would scuff the ball, thereby changing how it flies) to shoot balls through a network of light sensors set up to measure the effect of drag and lift forces on the ball. Because the relationships among spin, velocity, lift, and drag are complex, they conducted a variety of tests and different speeds and spin-rates. They used a set of “new” balls that were set aside for testing for every season from 2012 to 2017, as well as actual game balls, or “authentication balls” that were hit once or twice during games from 2012 to 2017 before being retired.
The aerodynamic testing points to changes in drag being the main culprit, a finding that gibes with the other analysis conducted by the authors. “All three analyses — StatCast, WSU authentication balls, and WSU new balls — indicate that the drag coefficient of Major League baseballs has changed since 2015,” the authors write.

Aerodynamic testing confirmed a change in the drag coefficient in balls from 2012 to 2017 (Source: MLB report)
The authors looked for changes in the baseball that could account for the decrease in drag, such as seam height, center of gravity, and surface roughness. Seam height does vary in MLB balls, but not by enough to have the impact that the authors were seeing.
However, differences in the ball’s center of gravity could be contributing to changes in ball drag by inducing a wobble, the authors concluded. Likewise, differences in surface roughness could have an impact, the authors concluded.
“Various hypotheses have been proposed and tested, including gradual changes in the manufacturing process a affecting the centering of the pill within the baseball or the deformation of the baseball while spinning,” they conclude. “There is an ongoing effort to develop more precise measurement techniques to investigate these hypotheses.”
In the meantime, the home runs will keep piling up.
Related Items:
Deep Learning Is About to Revolutionize Sports Analytics. Here’s How
Today’s Baseball Analytics Make Moneyball Look Like Child’s Play
Leading Solution Providers


Tabor Network
Sponsored Multimedia


Featured Events
-
Call & Contact Center Expo
 April 24 - April 25Las Vegas NV United States
 -
AI & Big Data Expo North America 2024
 June 5 - June 6Santa Clara CA United States
 -
AI Hardware & Edge AI Summit 2024
 September 10 - September 12San Jose CA United States
 -
CDAO Government 2024
 September 18 - September 19Washington DC United States