

January 29, 2018
Hidden Anomalies No Match for LivePerson’s Machine Learning Engine
LivePerson knows a thing or two about customer service. After all, the company runs the global chat and messaging infrastructure that connects 18,000 businesses like Citibank and Home Depot with millions of their own customers. But when the chat services start to flutter across LivePerson’s sprawling IT infrastructure, as any computer application will occasionally do, the company turns to the power of machine learning to get the upper hand.
LivePerson is a bit unique among software-as-a-service (SaaS) firms. While many SaaS outfits rely on Amazon Web Services or Microsoft Azure to provide computers for them, LivePerson owns and operates its own IT gear. All told, the company runs its services, including its popular LiveEngage platform, atop nearly 10,000 virtual machines running on about 2,000 physical servers located in six data centers around the world.
Keeping on top of this sprawling infrastructure is no easy task, particularly when you’re committed to supporting upwards of 13,000 concurrent customer interactions, as LivePerson is. A few years back, LivePerson re-architected its core platform around microservices and containerized infrastructure to simplify the application development, testing, and deployment process for developers.
However, while the new Kubernetes-based microservices architecture did help developers, it made life more difficult for the administrators tasked with keeping things running. Trying to troubleshoot a problem in such virtualized environments is notoriously difficult. That’s when LivePerson started exploring the potential for machine to learning systems to help monitor its services.
Virtualized Trouble
LivePerson is a big user of open source big data tech, including Apache Kafka, Apache Cassandra, and the Elasticsearch stack for data logging. The $223-million publicly traded company uses Graphite and Grafana to generate metrics and display interactive dashboards based on the log data gathered by Elasticsearch.
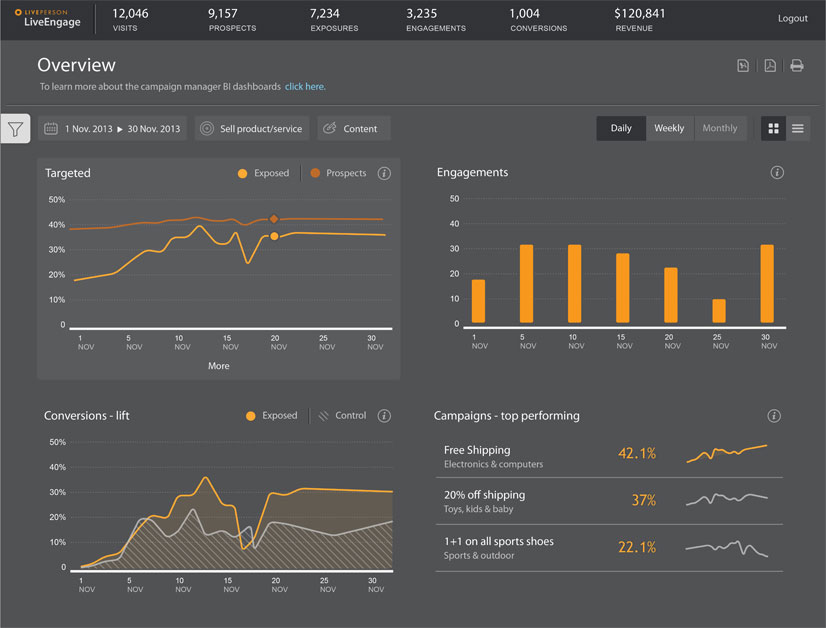
LivePerson relies on the Elasticsearch stack, including Graphite and Grafana, to serve metrics to customers
According to LivePerson’s Director of Production Engineering Oded Avissar, Graphite and Grafana track a mind-boggling amount of data for LivePerson’s business: 2 million metrics updated every 30 seconds.
These metrics include both IT-centric measures, such as CPU and memory consumption, as well as application- and business-centric metrics, like how many customers are currently being connected in LiveEngage and what the average wait time is.
Parsing through all that data to find the pieces that matter – which are usually the anmolies –is a real challenge, Avissar says.
“Graphite and Grafana are great at giving you the visualization of these metrics and generating a great dashboard,” Avissar tells Datanami. “But it doesn’t really give you the insight on what’s going on with the anomalies themselves, and if something has changed or not.”
About four or five years ago – after the New York City-based company switched to a virtualized microservices-based architecture – the company began exploring how machine learning could help analyze all that data. The company tried using the open source Skyline machine learning software to analyze the log data stored in Graphite, but it didn’t pan out. It tried several others that also didn’t pan out.
Then one of Avissar’s acquaintances is Israel who worked at a nearby startup recommended that he check out a software company named Anodot. Avissar’s acquaintance was using Anodot’s machine learning software for time-series data, and suggested that it could be a good fit for LivePerson’s real-time data glut.
Anodot was founded in Israel in 2014 when trio of technologists realized there was an unmet need for fast and accurate time-series analysis. Frustrated by other time-series approaches, the company created a shrink-wrapped product that uses a collection of 30 different machine learning algorithms to tease patterns out of data. In particular, it uses both univariate and multivariate anomaly detection techniques, which allows the company to “tune” the models to specific data types, as we explained in a feature on Anodot back in August.

LiveEngage is designed to support up to 13,000 concurrent customer chat and messaging sessions across Web, mobile and other interfaces
Avissar gave Anodot a shot, and was immediately impressed with how the cloud-based software cut through the data to highlight meaningful anomalies. “Until we started looking at Andot, we couldn’t find anything that we could fine tune and didn’t give us a lot of false positives,” he says.
Anomalous Machines
The trick for LivePerson is to find real anomalies hidden across those 2 million metrics that are updated every 30 seconds, and not just something that happened due to seasonality, Avissar explains.
“Our trends, our metrics, are very seasonal, so we have peaks during the rush hours and they go down as the day progressed,” he says. “This is something that Anodot does very well. It learns the trends. It understands what is to be expected from this metric.”
If something truly out of the ordinary happens — such as the number of connected agents for a particular customer doesn’t start increasing at 8 a.m., when agents typically start signing in to work — then “Anodot gives us an alert and tells us, something is wrong,” Avissar says.
Once an alert is sent, LivePerson engineers will jump onto Graphite and Grafana clients to drill down into the problem. The problem may also be detected by other rules-and threshold-based monitoring systems, too, but Anodot and its machine learning approach will typically surface the problem before those other systems do.
“It buys us time to understand what’s going on before we reach anything that’s critical,” Avissar says. “Our other tools also give us alerts, but usually Anodot gives us a heads up before our other tools kick in. These are things that are very beneficial, especially in SaaS systems, where any downtime can affect a lot of customers.”
Business Correlations
Since LivePerson runs its own IT infrastructure, it must stay on top of both the IT-specific metrics as well as the business-specific metrics. Finding correlations between those two sets of data is not easy, but it’s something that Anodot excels at, Avissar says.
“Doing the correlation between the infrastructure monitoring and the business monitoring, and showing you on one sheet when an event happens — that is something that’s very strong,” he says.
In addition to generating email alerts, Anodot provides a Web-based interface where LivePerson engineers can explore anomalies in greater detail. If an anomaly has been detected by Anodot, Avissar will often check out the product’s Web client to explore more details around it.
“You can look half-an hour before [the anomaly] and half-an-hour later for all the anomalies that happened on that data center or on that system. You can see all the anomalies that happened at that time,” he says. “It gives you good cause and effect of what happened.”
It’s not uncommon for LivePerson to receive an alert from Anodot about a problem that a customer hasn’t even noticed yet, or perhaps was caused by an IT issue with the customer’s own system. “These are very valuable alerts and anomalies for us because they have to do with the business itself,” Avissar says.
Today’s distributed applications are extremely powerful, but they’re also incredibly complicated. Troubleshooting problems in such platforms is not an easy task. But thanks to powerful tools like Anodot, LivePerson has a better shot at getting ahead of problems before they impact customers, which is just good service.
Related Items:
Inside Anodot’s Anomaly Detection System for Time-Series Data
Elastic Adds ‘One Click’ Anomaly Detection to Stack
Applications:
Data Mining
Leading Solution Providers


Tabor Network
Sponsored Multimedia


Featured Events
-
AI & Big Data Expo North America 2024
 June 5 - June 6Santa Clara CA United States
 -
AI Hardware & Edge AI Summit Europe
 June 18 - June 19London United Kingdom
 -
AI Hardware & Edge AI Summit 2024
 September 10 - September 12San Jose CA United States
 -
CDAO Government 2024
 September 18 - September 19Washington DC United States