

February 3, 2017
Are You Ready for Some Football Analytics?
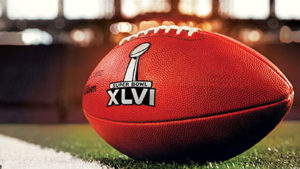
In professional sports, Major League Baseball arguably has the richest tradition of using statistics to predict the success of teams and individual players. But data science is quickly making a mark on the National Football League too, and fans will get to watch two of the biggest adopters of analytics compete this Sunday in Super Bowl LI.
We’ve seen an explosion of sports analytics since Michael Lewis wrote about the incredible results that Oakland A’s General Manager Billy Beane got by applying sabermetrics to his player selection process. In this post- Moneyball world, complicated formulas to predict player performance, such as WAR (wins above replacement), have become a standard part of the game. Quants have evolved the practice so far and so quickly that traditional statistics, like batting average, have become quaint by comparison.
NFL teams have been slower to gravitate to data analytics than their MLB colleagues, but they’re quickly catching up. In fact, the strategic nature of the game itself lends itself quite nicely to data science, argues Professor Konstantinos Pelechrinis of the University of Pittsburgh School of Information Sciences.
“While American football is viewed mainly as a physical game—and it surely is—at the same time it is probably one of the most strategic sports games, a fact that makes it appealing even to an international crowd,” Pelechrinis writes in a recent research paper, “The Anatomy of American Football: Evidence from 7 Years of NFL Game Data.”
In his paper, Pelechrinis describes how he developed a model that sought to predict which team will win a given game–something that will be of interest to bookkeepers in Las Vegas as well as novice fans. He analyzed seven year’s worth of NFL game data to discover what correlations certain metrics–such as the number of turnovers, the number of penalties, time of possession, total yards, and run/pass ratio—have with the win/loss decision.
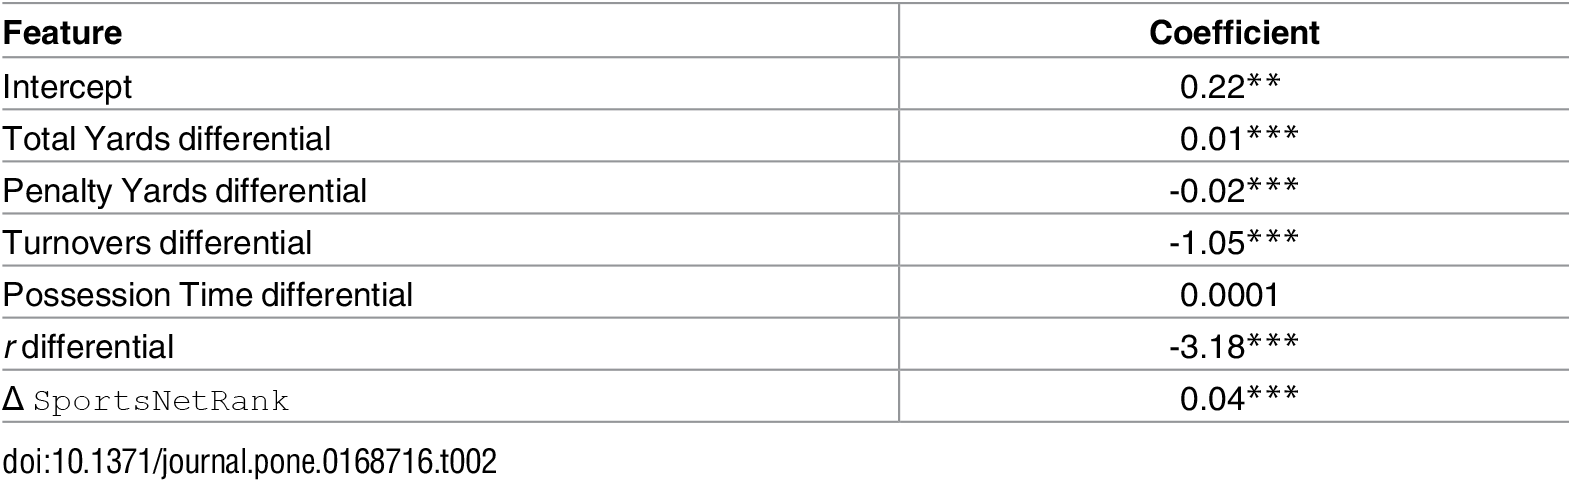
The weightings in Konstantinos Pelechrinis’ model
He weighted these various co-efficients to the best of his ability, and ran them through a Bradley-Terry regression model. In the end, the model demonstrated that it could predict the winner of a game with 84% accuracy, he wrote.
“Clearly the conclusions drawn from the regression cannot and should not be treated as causal,” Pelechrinis concluded. “Nevertheless, they provide a good understanding on what is correlated with winning games. For example, if a team wins the turnover battle by 1, it can expect to obtain an approximately 20% gain in the winning probability (all else being constant), while a 10-yard differential in the penalty yardage is correlated with just a 5% difference in the winning probability.”
While these are interesting stats, they’re not news to coaches, who already stress to their players the importance of turnovers and penalties. But there are other analytics that coaches are using to help guide decisions during the game.
Jesse Piburn, a geographic data scientist with Oak Ridge National Laboratory, has researched the growing use of analytics in football, and shared some of that research during a conference call with reporters yesterday.
Piburn says the odds are high that data science will have some impact on Sunday’s big game. “The Falcons and the Patriots…are actually two of the most analytically minded franchises in the NFL,” Piburn says, pointing out that Patriots owner Bob Kraft actually has his own data science firm called the Kraft Analytics Group (although it doesn’t work in the sports field).
“Probably the largest data science influence during the Super Bowl itself will be what is known as in-game win probability model,” Piburn explains. “Given a particular combination of circumstances– it’s the third quarter, you’re down by three, and it’s first and goal–what decisions could we make that will give us the highest probability of winning the game?”
Coaches for Atlanta and New England will have a barrage of statistics at their fingertips to help them guide their in-game decision making. Heat maps show that Patriots running back LeGarrette Blount almost always runs straight up the middle, while Falcons running back Devonta Freeman spreads it out more. They’ll show that Patriots quarterback Tom Brady prefers to throw short and to the left on first down, but often throws deep to the right on third down, while Falcons quarterback is more likely to go deep on first down.
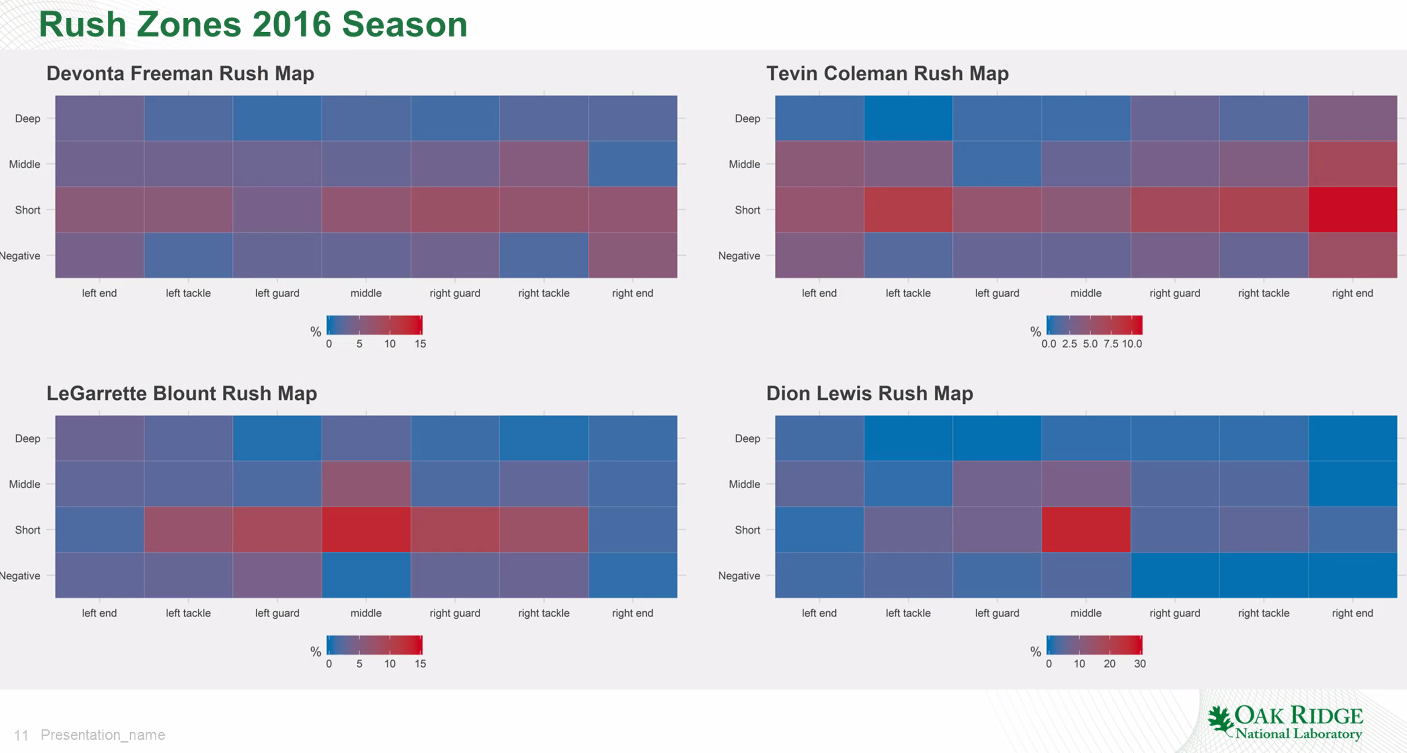
Piburn generated heat maps that show the distribution of running attack Falcons and Patriots running backs
The NFL has become a pass-first league of late, but that doesn’t mean the running game is obsolete. The Patriots are more likely to run the ball to protect a lead in the red zone (inside the opponents 20-yard line), but interestingly, the data shows the Falcons are more apt to run in the red zone when they’re losing. Selecting the proper personnel groupings and positioning the players to most effectively counter a run play or a pass play remains one of more strategic elements of the game, and coaches are increasingly consulting analytics to help guide their decision making.
But sometimes, the analytics can lead to coaches to make decisions that seem downright weird. We have a great example of that in Super Bowl XLVI (46 for non-Romans), when Patriots coach Bill Belichick instructed his defense to let the New York Giants score a touchdown. The Patriots were protecting a two-point lead when the Giants got the ball on the Patriots six-yard line with about one-minute remaining.
If the Patriots had contested the run, they likely could have forced the Giants to kick a game-winning field goal. But Belichick determined that would only leave the Patriots about 20 seconds on the clock. With only one timeout remaining, the odds favored letting the Giants score a touchdown.
Piburn has run the numbers on that situation. “If the Patriots would have forced that field goal, they would have ended up with 8% chance of winning the game,” he says. “However by allowing that touchdown on second down, it gave them a 15% chance of winning, even though they had to get a touchdown to try to win, because they had more time. They actually ended up losing that game, but at that moment, that was the correct decision.”
Most models indicate the Patriots have a 60% chance of winning the Super Bowl, Piburn says. “But if the Falcons can establish a running game, I think they’ll have a good chance,” he says.
Related Items:
How Super Bowl 50 Will Feed Our Super Appetite…for Data
How Madden’s Ratings Czar Rules NFL Analytics
When Data Analytics Goes Horribly Wrong: A Sporting Example
Leading Solution Providers


Tabor Network
Sponsored Multimedia


Featured Events
-
Call & Contact Center Expo
 April 24 - April 25Las Vegas NV United States
 -
AI & Big Data Expo North America 2024
 June 5 - June 6Santa Clara CA United States
 -
AI Hardware & Edge AI Summit 2024
 September 10 - September 12San Jose CA United States
 -
CDAO Government 2024
 September 18 - September 19Washington DC United States