

November 11, 2016
Six Data Science Lessons from the Epic Polling Failure

(Vaosh/Shutterstock)
Big data analytics suffered a huge setback on Tuesday when nearly every political poll failed to predict the outcome of the presidential election. The epic failure not only stunned a nation that expected Hillary Clinton to be elected but ended up with Donald Trump. It also left data science experts wondering how so many experienced pollsters could get it so wrong, and what they can do to ensure they don’t repeat the mistakes.
Think this wasn’t a failure of big data? Think again. Political polling is “clearly a big data exercise,” says Bill Schmarzo, the chief technology officer of the Big Data Practice of EMC Global Services. “There’s tons of big data that’s used in these polls to try to predict, on a county by county basis, who’s going to show up.”
Schmarzo watched the election unfold on Tuesday with a data science colleague in a Toronto bar. “I was amazed,” he says. “I try to stay out of politics, but from a data science perspective, it got me scratching my head trying to figure out how did we miss this? How did we miss this?”
As is usually the case, there was no single cause of the failure, but more of a cascade of failures that ended up surprising billions of people around the world. Here are six lessons that data science practitioners should take away from this election’s most unexpected outcome.
1. Models Have a Half Life
Data scientists spend much of their time building and tweaking models that they think (and hope) will accurately reflect the real world. While the model may work well when it’s developed, it will naturally lose effectiveness over time.
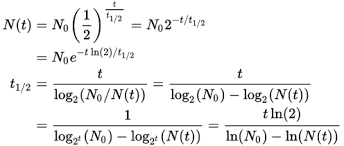
The equation for calculating half-life (Source: Wikipedia Commons)
“We know that over time these models decay and become less effect and the reason why is the world changes,” says Schmarzo, who teaches university courses in big data analytics and been called the Dean of Big Data.
“Think about what’s happened in the world since the last election,” he tells Datanami. “We’ve had the widening wealth gap, the growing student debt burden, several major public acts of corporate malfeasance, the number of under-employed. There’s all this changing sentiment that takes place, and if you don’t constantly refine your models and try to capture all the variables, then you’re going to get what we got on Tuesday, which was a big, big miss–a horrific miss.”
This is especially true when trying to model behavior of humans, who are constantly changing their views. “The advantage you get out of data science and analytics is fleeting. It can be copied. People can build upon it. So if you’re not always trying to move forward, I think you end up in a situation where your model gets stale.”
2. Don’t Get Lazy
Political pollsters almost universally misread voter sentiment in 2016. It’s a huge black eye for data scientists like Nate Silver, the FiveThirtyEight founder whose near-perfect score predicting results of presidential elections since 2008 came to a bloody, unexpected end. Silver did correctly predict the outcome in 41 states–but the nine he missed were the ones that swung the election Trump’s way.
“We got overconfident. We got lazy,” Schmarzo says. “We as data scientists took heart in the models we had, and eventually they weren’t right anymore.”

(lenetstan/Shutterstock)
Data scientists must acknowledge that their models will naturally lose accuracy over time, and take pains to make it right. Just as Golden State Warriors guard Steph Curry must continually work on his three-point shot, and Chicago Cubs third baseman Kris Bryant must continually work on hitting curveballs, data scientists must keep working on their models, just to keep them from losing predictive power, let alone make them better.
“We were all blind to it because we were so confident in what we had done in the past,” Schmarzo says. “I think Nate Silver is wonderful. He really helped to put big data into the mainstream conversation. I have a lot of respect for him. But he missed it because he didn’t grow his models. He didn’t evolve them. He missed some other variables that were out there that would have helped to make his models more efficient.”
The lesson from this election is do not get overconfident in the models you build, because the world is changing, Schmarzo says. “You’ve got to continually be looking at all these new data sources,” he says. “To me that’s lesson number one. Don’t trust your models. Constantly challenge them. Constantly try to see if you can make them fail. That’s how you make them better.”
3. Seek More Data
Complacency on the part of political pollster and the mainstream media led to some pretty significant errors in judging voter sentiment. Schmarzo’s colleague demonstrated this with a fairly simple exercise conducted from the Toronto bar.
(David Pereiras/Shutterstock)
“My data scientist friend looks at me and says, ‘Trump is going to win Florida.’ I looked at him and said, ‘No he’s not. Nate Silver says Hillary has it locked up.’ He says, ‘He’s wrong.'”
To prove Trump would win Florida, Schmarzo’s colleague downloaded video of several rallies the candidates held in the Sunshine State. Then he used a video analytic tool to conduct a headcount. The results showed that the press was grossly underreporting the number of people at the rallies.
“The press had these general numbers, of saying there’s a couple hundred of people there,” Schmarzo says. “In some of these rallies Trump was getting 400 to 600 people, and Hillary was getting 150 to 200.”
While the media did not highlight the difference in voter turnout for the two candidates as an indicator of voter sentiment, it could have served as a proxy for voter engagement. It was another missed opportunity for the press and the pollsters to correct their erroneous view of the mood of the electorate.
4. Avoid Herd Thinking
One of the reasons why the polling failure was so stunning is that nearly every pollster got it so wrong in the same direction. The fact that nearly every major poll had Clinton winning in rather convincing fashion shows there was a herd effect at work. Even Trump’s own team pegged his chances at 30% on election day.

(EyeSeePictures/Shutterstock)
The one poll that had Trump winning, the LA Times/USC Daybreak poll, was castigated by Democrats as an “outlier” during election season, even though it’s the only one to correctly predict the makeup of voter turnout. (Short explanation: It had a much more complex model that more heavily weighted white voters, which turned out to be the deciding factor in the Rustbelt states where Trump swung the election.)
When polling data showed the race tightening in the week leading up to the election, Silver attempted to incorporate this trend into his ensemble model. Dr. Kirk Borne, principal data scientist at BoozAllenHamilton, says Silver’s approach was correct.
“I do believe that Nate Silver (FiveThirtyEight) made a justifiable and appropriate effort last weekend to incorporate the positive trending of Trump numbers as a positive slope in the predictions for what would happen on Election Day,” Borne tells Datanami.
“But then Nate took a lot of heat for doing that. I disagreed with those critics and I agreed with Nate: that this is the proper way to build a predictive model when you have trend lines in the data. It worked for him in the past, and his model was heading in the right direction this time too (as we now know). Hindsight is 20-20, but I had those thoughts well before Election Day about Nate’s correctness in incorporating a trending component in predictive models!”
5. Mirror Rising Complexity
The models used by most professional polling organizations are largely based on demographics that attempt to mirror the makeup of the electorate in terms of certain demographics, like race, gender, age, income, and socio-economic status. The weightings in the demographics were based largely on how the various demographics performed in the last election.

(Kjpargeter/Shutterstock)
Up to this point, this buckets- and history-based demographic approach has worked well enough for pollsters, who could rely on scientific sampling methods to deliver a result with a margin of error between 3% and 4%. In the 2016 race, which was tighter than nearly everybody realized, the lack of precision of older demographic-based modeling methods turned out to be a major factor, says Michele Chambers, the CMO and EVP of Continuum Analytics.
“The lesson learned is we have to improve the way we model for elections,” Chambers says. “In business, people have been learning that lesson for quite some time. Originally, we were building models, with smaller samples and we were doing it on aggregated data. The big epiphany around big data is the realization that you can build models on transaction or the lowest level of detail. By doing that you get much more precise, and you can see patterns much faster in larger amount of data.”
In the future, don’t be surprised if more pollsters emulate the Daybreak poll, which had a fairly complex model.
6. Account for Irrational Behavior
Opinion surveys are based on the assumption that people will accurately telling the pollsters what they intend to do. But the fact is that people often don’t do what they say they’ll do. And sometimes, they’ll do the complete opposite of what they say.
 This likely contributed to additional error in the 2016 polls, as many Trump voters either lied about who they were going to vote for, or avoided telephone surveys at higher rates than Clinton supporters (which the Daybreak poll documented.)
“What people are saying and what the way they’re actually behaving are inconsistent, so we have to take into account the difference between their demographics and psychographic behavior,” Chambers says.
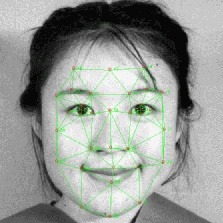
If pollsters had used additional data-gathering techniques, such as facial and linguistic analytics, they could have detected these acts of duplicitousness and gained a more accurate view of voter sentiment, she says.
“Adding facial recognition and doing linguistic analysis is really going to net them much more precise results,” Chambers says. “When you have a landslide, the margin of error doesn’t matter. But when you have a close race, and when people don’t necessarily represent their true feelings accurately, that’s where a more complex model that understands the reality of our complex world is going to be a lot more precise.”
Related Items:
Polling Data Hidden in Plain Sight
Trump Victory: How Did the National Polls Get It So Wrong?
Technologies:
Middleware
Sectors:
Government
Leading Solution Providers


Tabor Network
Sponsored Multimedia


Featured Events
-
Call & Contact Center Expo
 April 24 - April 25Las Vegas NV United States
 -
AI & Big Data Expo North America 2024
 June 5 - June 6Santa Clara CA United States
 -
AI Hardware & Edge AI Summit 2024
 September 10 - September 12San Jose CA United States
 -
CDAO Government 2024
 September 18 - September 19Washington DC United States