How Data Scientists Are the New Backbone of Storage Infrastructure

(Nmedia/Shutterstock.com)
Today’s IT teams have enough on their hands managing data-storage infrastructures, without having to worry about issues with an array or latency problems that no one seems to be able to understand or solve. But what if the customer support around these issues could be managed by a team that is systematically ingesting and cleanly organizing a huge variety of customer data to pinpoint the exact issue?
This is where data scientists come in. Data scientists today are dissecting and analyzing trillions of data points to identify and solve the problems that keep IT teams up at night. As data-center infrastructures continue to become more complex, data scientists are treating the ever-increasing workloads weighing down IT teams. They demonstrate the power of the infrastructure to allow the answering of many arbitrary, unpremeditated questions about a customer’s environment with relative ease. Following we explore the ways in which data analytics is quickly becoming a critical component of IT — and how data scientists can empower IT teams with greater visibility into their entire infrastructure.
Big Data Is Essential for Technical Support
Providing effective and efficient technical support for data-storage infrastructure is a hard problem. In large part, this difficulty stems from the complexity of the IT stack. Complex interactions between complex products create a wide variety of technical problems ranging from the subtle (misconfigurations, product conflicts, software bugs, resource imbalances) to the mundane (loose cables). To diagnose problems in this environment, an equally wide variety of information is necessary — and because of this, a big data solution is required.
The conventional technical support paradigm goes like this: A customer calls a level 1 support engineer and if the problem isn’t in his or her runbook, the customer is escalated to level 2 and so on. Diagnostic information is requested, gathered, transmitted and analyzed manually for both the common, easy-to-diagnose problems and the one-off posers. By adding data science to the mix, you can instead continuously collect diagnostic telemetry and build rules off of it to detect known problem signatures. Technical support can then automate away a large portion of its workload while simultaneously improving the customer experience. This way, customers don’t have to spend time on the phones repeatedly asking the same questions, and the support provider need only hire top-end talent to deal with more uncommon, unanticipated and trickier-to-diagnose issues.
While it’s great that a big data solution can automate identification of common technical issues, the potential value of such a system becomes even more apparent in the context of enigmatic problems. The key to a solution that can assist in these scenarios is for a single client to accept single queries that can:
- Compare disparate types of information (e.g., logs, configuration settings, timecourse data)
- Compare information from different sources (e.g., the storage appliance, the hypervisor)
- Compare up-to-date data with historical data
- Allow arbitrary computation on the queried data
- Allow complex queries to be expressed succinctly
- Return results in a timely manner to allow for interactivity
By accomplishing the above, many unpremeditated questions about a customer’s environment can be asked and answered with relative ease, empowering the user to follow a chain of hypotheses to its natural conclusion. So how about an example of using data science to reach this type of solution?

(Mmaxer/Shutterstock.com)
A Virtual Mystery: What’s Causing These Latency Spikes?!?
Not long ago, our technical support team received a call from a customer experiencing what they perceived as a sporadic performance problem in their virtual environment (supported by our storage array). Every once in a while, their environment would slow down and none of the other vendors they had called (e.g., network vendors, hypervisor vendors) could figure out the issue. At that point, our data science team was asked to take a look. By leveraging query-able infrastructure, the initial investigation didn’t require us to contact and interrogate the customer or go digging around manually on their systems — instead, we started with a few short queries and took the following steps.
Exploratory Analysis
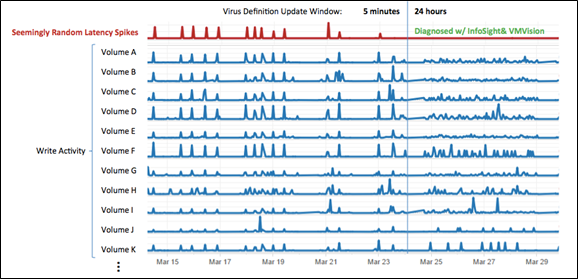
First, we ran a quick query to plot activity on the array over time. This showed that the storage array was experiencing latency spikes due to short, approximately five-minute bursts of enormous write activity for which the array was not sized. Some might have stopped there and responded with, “Buy more hardware — you need more resources for that level of activity.” Looking at the data, however, the spikes in write activity were so much higher than the baseline that this did not look like a customer simply outgrowing their hardware. Some process was hitting the array hard and fast and it probably didn’t need to be. The question was: which process?
Hypothesis 1
At that point we posed a hypothesis: Could a specific Cron job be the culprit?
We ran another quick query to check: If a Cron job was at work, we would expect a regular temporal pattern of occurrences. The query showed that the bursts of write activity were happening between zero and three times each day with no apparent schedule.
Hypothesis 2
Since a Cron job didn’t look likely, we wondered if we could isolate the writes to some subset of the data, either on the array or in the virtualized environment. If we could, that would let us see what applications or data resided there and from that, we could try to suss out a root cause. To test this hypothesis, we hammered out a query to quantify the correlation between the array-level spikes in latency and the write activity of each volume, host, virtual machine and virtual disk in the customer’s environment for the previous few weeks.
Looking at the volumes: Roughly half of all volumes correlated strongly, and there was no immediately obvious pattern in which volumes were most strongly correlating.
Looking at the hosts: Here we saw a similar result — a significant proportion of the hosts’ activities correlated strongly, and again there was no obvious pattern.
Looking at the virtual machines: Again, no specific machines stood out; the activity was widespread but synchronized.

(Ph0neutria/Shutterstock.com)
Lastly, looking at the virtual disks: While again no individual disks stood out, the disks with their writes most synchronized with the array latency tended to be the operating-system (OS) partitions or C: drives on virtual machines running Windows. This was an interesting clue. Also interesting was that individual virtual disk activity did not always spike at the same moment within the five-minute window; looking across the disks active during that interval, the start times of their activity seemed almost uniformly distributed within those five minutes.
Hypothesis 3
Because of how synchronized the activity was, we postulated that contention for shared host RAM could cause information to page to storage on multiple virtual machines at once. However, a quick query to the balloon driver stats eliminated this hypothesis.
Hypothesis 4
The random timing of the write activity combined with the synchronicity of the writes coming from the Windows OS partitions led us to suspect some kind of either software-update activity or virus-scan activity. At this point, our sales engineer engaged with the customer to investigate their software update and virus software settings.
Sure enough, the customer’s anti-virus software was configured to push any newly identified virus definitions to all of the Windows virtual machines in the environment within five minutes of those updates becoming available.
The Proof In the Pudding
Given the mounting evidence, the customer changed their virus software configuration. Each virtual machine would now install its update at a random time within 24 hours of the release of the update, rather than within a five-minute window. Because of this the periods of slowed performance ceased, never to return.
This example highlights how a big data solution for operational intelligence can help resolve thorny IT issues. By maintaining telemetry from not only our own storage product but also the hypervisor, we were able to diagnose a configuration issue in yet a third product that was impacting the entire stack.
As data center infrastructure continues to increase in complexity, holistic visibility into the stack — including the storage, hosts, network and applications — becomes increasingly important to provide effective technical support. Data analytics is proving to be a key ingredient in providing this support. The more hypotheses that can be succinctly explored and answered by your solution, the more rapidly even the most enigmatic problems can be solved.

About the author: David Adamson is a staff data scientist at flash storage company Nimble Storage. David and his team are tasked with developing the InfoSight platform, which enables Nimble to monitor the health and needs of its customers’ data infrastructure. As a data scientist, David develops mathematical models to predict application resource needs, to automatically diagnose data infrastructure problems, and to proactively prescribe solutions to those problems. Prior to joining Nimble in 2013, he developed mathematical models to explain gene regulatory circuits, which serve as the control mechanisms of cellular behavior. David has his doctorate in biophysics from the University of California, Berkeley, and bachelor’s degrees in physics (B.A.) and chemistry (B.S.) from the University of Chicago.
Related Items:
Which Type of SSD is Best: SATA, SAS, or PCIe?


