

January 17, 2014
Zooming Through Historical Data with Streaming Micro Queries
Stream processing engines, such as Storm and S4, are commonly used to analyze real-time data as it flows into an organization. But did you know you can use this technology to analyze historical data too? A company called ZoomData recently showed how.
![]() In a recent YouTube presentation, Zoomdata Justin Langseth demonstrated his company’s technology, which combines open source stream processing engines like Apache with data connection and visualization libraries based on D3.js.
In a recent YouTube presentation, Zoomdata Justin Langseth demonstrated his company’s technology, which combines open source stream processing engines like Apache with data connection and visualization libraries based on D3.js.
“We’re doing data analytics and visualization a little differently than it’s traditionally done,” Langseth says in the video. “Legacy BI tools will generate a big SQL statement, run it against Oracle or Teradata, then wait for two to 20 to 200 seconds before showing it to the user. We use a different approach based on the Storm stream processing engine.”
Once hooked up to a data source–such as Cloudera Impala or Amazon Redshift–data is then fed into the Zoomdata platform, which performs calculations against the data as it flows in, “kind of like continues event processing but geared more toward analytics,” Langseth says.
“We use that for real time data but also for historical,” he continues. “Instead of launching big queries and waiting for results, we run streams of little tiny queries against historical data and process the results of those micro queries, as we call them, also through the stream processing engine. That allows us to very quickly visualize very large sets of data, and do it almost instantaneously.”
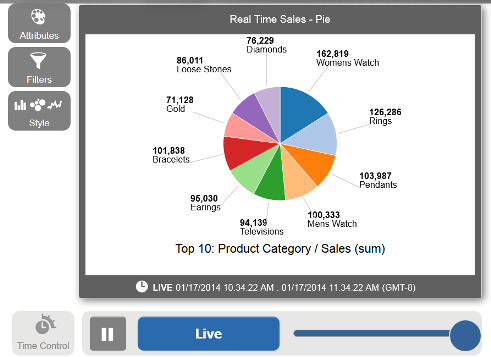
The Zoomdata “Time Bar” feature provides a DVR-like interface that allows users to zoom forward and backward through time to see how various properties change. “You can see the historical data as run through the stream processing engine,” he says. “When you get back to the live point, it stops fast forwarding.”
 Using micro queries allows Langseth and company to keep everything working fast and intuitively despite the large data sets measured in billions of records. “As the micro queries come in, it allows us to draw an estimated picture of the data within a second or so, and then as more micro queries come in, we sharpen, if you will, the result display,” he says.
This is similar to the way YouToube works. “If you start playing a You Tube video, it starts out kind of fuzzy, but it’s watchable and it starts immediately instead of buffering for 30 seconds like in the old days,” Langseth says. “So we’re doing the same thing for the historical micro queries against the big data. As you watch it, it gets sharper and sharper.”
Zoomdata, based in Reston, Virginia, received a U.S. patent this week related to its real-time data visualization technology. The company received $4.1 million in venture funding last year.
Related Items:
Big Data Spending to Hit $8M Per Organization, IDG Says
Datanami Dishes on ‘Big Data’ Predictions for 2014
Data Scientists–Who Needs Them Anyway?
Technologies:
Middleware
Vendors:
Startups and More...
Leading Solution Providers


Tabor Network
Sponsored Multimedia


Featured Events
-
Call & Contact Center Expo
 April 24 - April 25Las Vegas NV United States
 -
AI & Big Data Expo North America 2024
 June 5 - June 6Santa Clara CA United States
 -
AI Hardware & Edge AI Summit 2024
 September 10 - September 12San Jose CA United States
 -
CDAO Government 2024
 September 18 - September 19Washington DC United States