

September 28, 2012
Spelunking Shops and Supercomputers
While this might come as a surprise to those outside the bubble, the majority of data that is collected within an enterprise setting is machine-generated.
 In other words, everything from operational data (messaging, web services, networking and other system data) to customer-facing systems (online services, for example) to the actual machine-fueled streams of data (GPS, specialized instruments, logs about deliveries, etc.) is filtering in via remote devices, sensors, the web, the cloud and of course, from a company’s own data-generation habits.
Certainly this creates a rather complex set of problems, in part because much of this data is affiliated with a particular silo—and often one that has its own set of specific tools required to manage it. In other words, obtaining a holistic view of all of these various sources of the data flood is difficult and laden with its own host of complexity and management issues.
If we’ve learned anything from the big data craze, however, it’s that companies are starting to think that there really is no junk data. While we could debate this all day long, whether it’s being clung to for regulatory purposes or housed for some rainy day analysis, companies are realizing the potential value in these distributed puddles leftover from the multi-directional flood of data. This information isn’t just about spotting silo-specific issues, either—although it can be. For instance, a clean way of seeing network data meshed with overall operational efficiency certainly can have its value. Businesses now are asking more of their data—and want ways to shove it together in a neat package that serves the needs of the silos as well as the overall management bird’s eye view.
According to Splunk, which aims to burst the silos and create a clean dam for the data to reside in (where it can easily be fished out, even by the lesser experienced fisherfolk), recent efforts on the monitoring and analysis front are still not keeping up with the demand for solid understanding of the whole of enterprise data wells. The company claims that “value from data is still largely untapped, in part because it’s extremely difficult to process and analyze by traditional methods or in a timely manner.”
Leena Joshi, who directs application management and cloud solutions marketing at Splunk explained the core concept behind Splunk by pointing to standard relational databases with their rigid schemas and highly defined reporting capabilities. While these have served their purpose, she says there is a growing category of data that only snaps into multi-dimensional databases and come with a rigid schema for the purposes of rather complex analysis, often with a real-time angle.
She says that the problem here is that all that data would need to be normalized—a task that is incredibly complicated and slow. With Splunk, the normalization layer is removed as Splunk can automatically read that data by creating what Joshi describes as a “schema on the fly” wherein key value pair detection is automatic, patterns can be specified, and a large number of statistical or mathematical operations can be rendered to crunch that data quickly given the diversity of data Splunk can gobble.

So you might ask, what about Hadoop’s role here? Splunk’s Joe Fitzpatrick says that for almost every Hadoop use case (and there are only tentative experiments going on with at large enterprises, he notes) Splunk would deliver better performance with less complexity. Splunk, he claims, is good at complicated analysis and multi-tiered correlations. So if you have to write code to articulate the questions you want to ask of your data, that’s where Hadoop plays well. However, “we’re centered around machine learning and time-series data, so if you’re looking to basic word counts or analysis of static data, that’s not our strong suit—it’s more suited to Hadoop.”
Sharp puts this into clearer context when he talks about his past experiences as a customer of Splunk at a Tier-2 telco. In his role as application operations lead he was responsible for almost everything in the IT stack, from middleware to CRM to billing operations to BI, ERP and more. While they had a solid APM suite and all the traditional up-down monitoring tools, they needed a more focused way to ingest and analyze the data.
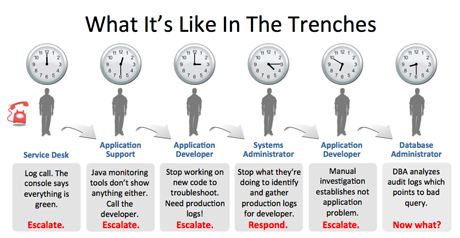
“We used to have a full-time person whose sole job was to zip up log files and mail them to our dev team all day” he explained. “Since we wanted to give our developers production logs without actually letting them into production, Splunk let us do so without this constant file zipping.” Further, he says, “we had a proprietary in-house middleware system that had a bunch of metrics being logged but no way for us to graph that over time. If we wanted to do that it would mean a bunch of time building Business Objects reports across the board—but with Splunk it was simple. We just took our log files, plopped them into Splunk and had the reports we needed.”
While Sharp’s role at Splunk is to make it seem as attractive as possible, there’s some real value in actual real-world context. When we started a discussion about scale, he quickly pointed to a creatie case study that shows off Splunk in a whole new setting and scale via a supercomputing example.
NEXT – Spelunking Supercomputers >>
As Jon Stearly and his team at Sandia National Laboratories found, Splunk could be successfully applied to help to tie together at the large cluster scale. Stearly explains that when it comes to supercomputers, with their diverse components that operate at a variety of scales, “the resulting logs are diverse in format, interrelated at multiple scales, and provide evidence of faults across subsystems.”
When the users mesh config details, upstream and downstream causes and events, and the multitude of other noisy elements, putting the data together across complex queries can be tedious and slow—and no simple task for the data scientist either. The team reported that using the Splunk log analysis tools and search language “reduced hours of tedium to seconds of simplicity, and its tags, saved searches, and dashboards offered both operational insights and collaborative vehicles.”
Their claim to fame (and that’s the right word to use—since when do we see IT monitoring on the big financial news shows these days?) is how they ingest and address all that data. And when the company’s CEO claims that Splunk “is the Google of big data” one has to wonder how this is—and what new uses might come as the technology behind clever ingestion and analysis matures further.
Sectors:
Other
Vendors:
Startups and More...
Leading Solution Providers


Tabor Network
Sponsored Multimedia


Featured Events
-
Call & Contact Center Expo
 April 24 - April 25Las Vegas NV United States
 -
AI & Big Data Expo North America 2024
 June 5 - June 6Santa Clara CA United States
 -
AI Hardware & Edge AI Summit 2024
 September 10 - September 12San Jose CA United States
 -
CDAO Government 2024
 September 18 - September 19Washington DC United States