

October 7, 2013
Six Steps to Extract Value from Big Data
Sponsored Content
A top challenge facing businesses trying to adapt in the new age of big data is determining how to extract value from their data. Businesses that leverage information obtained from their data have a competitive advantage over those who don’t. However, companies have begun to consolidate and organize vast collections of disparate data sources and now may be wondering what to do next.
In order to understand the hidden value in a company’s biggest asset, its data, begin by identifying what sets the company apart. Examine the workings of the company and then explore the areas where the company needs improvement. Once you understand the goals of the business, you can begin to not only make decisions based on your expertise but also combine with objective analytical results based on your data. This process could provide insights to the company’s competitive advantages.
As an example, consider the healthcare industry. High-level goals of the industry are to provide exceptional service and healthcare for patients and to have innovative and inventive treatments of disease. The objectives suited to analytics are much more specific. For example, hospitals and their networks can use analytics to reduce the patient readmission rates. Physicians and nurses may not be aware of the factors that contribute to high readmission rates, such as early identification of high risk patients, staffing problems, lack of consistency among procedures, as well as certain characteristics of a procedure. Other, less obvious factors affecting readmission rates may emerge from clustering or other data mining techniques. The process used to decipher information from data is called the data analysis process.
The six steps outlined here will help your company build competitive advantages through data analysis. The data mining process is meant to be cyclical and repeat continuously.
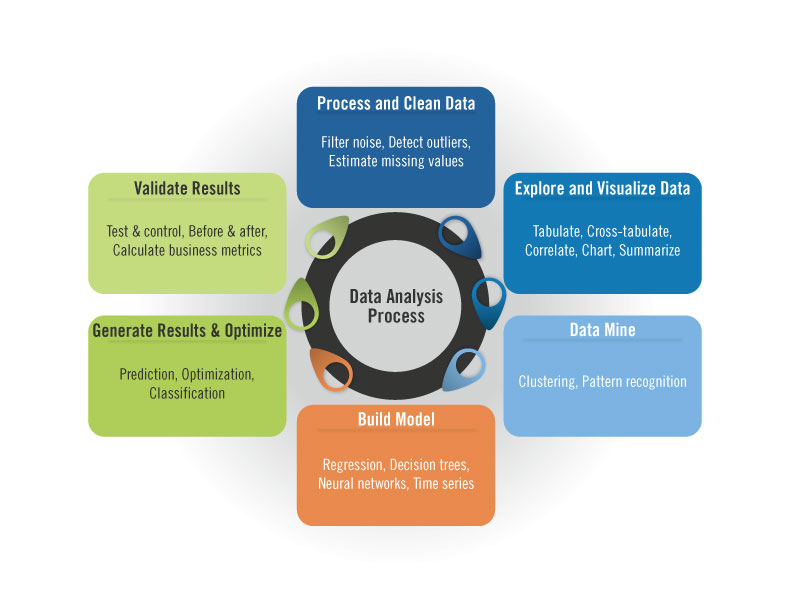
Step One: Process and Clean Data
It is important to verify your data matches your business goals. If it does not, there are several questions to address: What are the viable proxies? Are there outliers that need to be taken into account? Does the data contain bias? Are there missing values? Look for functionalities that will correctly address the various needs to clean and process the data. There are a number of methods that can be used to impute, or fill in missing values, such as mean interpolation, Kalman filter, and ARMA. This step is one of the most important, but may take 70-90 percent of your data analysis project time. The quality of your data will greatly affect your analysis results.
Step Two: Explore and Visualize Data
Explore the processed data and visually inspect the data for patterns, trends, and clusters. This is the time to examine relationships and build hypotheses according to your findings. The easiest way to complete this process is with the aid of visualization tools. There are a number of simple yet powerful visual aids, such as scatter plots, line graphs, stacked bar charts, box-plots, and heat-maps.
Step Three: Data Mine
You can use various methods to facilitate pattern recognition, including clustering K-Means, hierarchical clustering, market basket analysis, Kohonen Self-Organizing maps for visualization, principal component analysis, factor analysis, and multi-dimensional scaling. Organizations that leverage and mine their data predictively have a significant competitive advantage over their rivals, as they can gain important insights and react quickly to expand their business in a way that was not possible without predictive analytics.
Step Four: Build Model
Be sure to have a wide range of models that provide different perspectives of the data. Some possible models to consider are decision trees, Naïve Bayes classifier, neural networks, ARIMA, regressions, SVM, and discriminant analysis. Every algorithm has its suitability, and it is important to understand that all models have limitations. There could be more than one model that would work for a problem. Avoid overfitting. Understand not only the probable errors, but also the most serious ones, and set parameters to control against making the most serious of false inferences. Be sure to document and communicate the assumptions and results clearly.
Step Five: Generate Results and Optimize
Predictive results are used to establish objective functions in order to generate actionable results. There are many applicable methods, such as linear and quadratic programming, least squares solvers, and differential equation solvers (PDE, ODE). One specific method may be more appropriate than another depending on the nature of the objective function (linear, quadratic, or discontinuous) and constraints on the variables (linear or not). The goal is to produce results that lead to valuable business decisions. If the hospital staff knows a certain surgical procedure has high readmissions, they may change the process to help reduce readmissions, such as allowing for an extra day of post-operative care.
Step Six: Validate Results
After you implement your business decisions, allow time to produce results. It is important to carefully validate the results against the initial business objective. Returning to our healthcare example, the hospital’s business objective is reducing readmissions. Analysts should review data to see if current rates have declined in an appreciable way.
Selecting the Right Tools
You may find your toolkit stocked with several complimentary software products to support the data analysis process, among them analytic software that supplies mathematical and statistical algorithms. There are several important criteria to consider such as scalability, reliability, performance, data source consumability, and ease of deployment. When selecting a data analysis tool, it is important to consider these questions:
- Is the tool memory-bounded?
- Recognize that reliable software should inform users of data errors. What if user input data is not viable?
- Examine the size of the problem; does it have an informative message to let the user know what is happening or would it hang the application?
- Consider supported data type, format, and environments. This includes relational databases, structure and unstructured data, data connection support, and language support. Does the tool support streaming data? Can the analytic be used inside the database?
- In terms of performance and technology, what is the development as well as the target deployment environment? Will the analytics be thread safe? Does it support MapReduce (which will be needed for Hadoop)? Is the analytic software optimized for a deployment platform? Does it take advantage of multicore servers and can your computation be parallelized?
- What does the deployed solution look like? Does it use industry standard native language to simplify embedding in your web, Linux or Windows application and deployment? Has it been tested across platforms? If not, the computational results can be slightly different and cause differences in analytical results. Does it require any framework to support the deployment? If so, what are the additional hardware, software, and maintenance costs?
Predictability is a characteristic of the data process, not a characteristic of the model. You can use predictive analytics to go beyond merely improving the efficiency of your current processes; you can create new opportunities or products based on the insight you gathered from the data. While this process seems complicated, there are sophisticated, commercially-available tools that have been tested, tried, and in production, such as Rogue Wave Software’s IMSL Numerical Libraries, to help companies implement all six steps in this process. The IMSL Libraries provide sophisticated analytics in high-performance, mission-critical applications. With IMSL, companies and organizations reduce development time, realize a lower total cost of ownership, and improve quality and maintainability. Download the whitepaper “Driving Competitive Advantage by Predicting the Future” to delve into a deeper discussion of data mining and learn what predictive analytics can do for your company.
Leading Solution Providers


Tabor Network
Sponsored Multimedia


Featured Events
-
AI & Big Data Expo North America 2024
 June 5 - June 6Santa Clara CA United States
 -
AI Hardware & Edge AI Summit Europe
 June 18 - June 19London United Kingdom
 -
AI Hardware & Edge AI Summit 2024
 September 10 - September 12San Jose CA United States
 -
CDAO Government 2024
 September 18 - September 19Washington DC United States