

January 17, 2014
Earthquake Science Makes Headway in Big Data Era
The magnitude 6.7 earthquake that hit the Los Angeles area 20 years ago today surprised everybody. Not because temblors aren’t a regular occurrence in fault-riddled Southern California. But because the particular fault that triggered the quake was hidden and had not been identified. The chances of that occurring today are slim, thanks in part to much better instrumentation and data collection.
 The Northridge Earthquake killed 57 people, injured 8,700, and caused more than $20 billion in damage. The first earthquake to strike directly under an urban area in more than 60 years was felt hundreds of miles away, in Las Vegas, Nevada. The indelible image of collapsed freeway onramps and overpasses etched into the memories of millions of people in the car-dependent region.
As bad as the Northridge earthquake was, people here expect far worse. This wasn’t “the Big One,” as people in California say, and it didn’t come from the San Andreas fault, the mega-fault that one day will tear the state in two. This particular quake occurred on a previously unidentified fault in the San Fernando Valley region north of L.A., and it came from what’s called a “blind thrust” fault that is buried in the earth and not visible on the surface.
Following the Northridge quake, scientists with the newly formed Southern California Earthquake Center (SCEC) at USC fanned out to map the event. Twenty years ago, the seismic sensor network was predominantly analog, and recovering the seismogram data required extensive manual effort on the part of field technicians.
“To create the equivalent of this map in ’94, it took us two months that involved going out into the field and picking up film,” Lucy Jones, a Untied States Geological Service (USGS) science adviser for risk reduction, said in a presentation last week. “We had to get film recordings, develop them and digitize them, to be able to turn them into this map.”
During the Northridge quake, the USGS’ earthquake processing computer at CalTech was overwhelmed with data, Jones says. “That computer could not talk to us for over 2 hours,” she said. “You have significantly more computing power in the smart phone in your pocket now than we had in all of the computers in the seismology lab in 1994.” Because of the data overload, the local USGS office had to call the agency’s headquarters in Colorado to get an initial take on the event.
 Since then, the analog network that yielded seismograms has largely been digitized, and today 400 or so digital seismic sensors run by the Southern California Seismic Network (SCSN) and 250 more GPS sensors continuously upload seismic and earth-movement data from the field directly to the SCEC’s Southern California Earthquake Data Center (SCEDC). Following an earthquake, the “shake maps” can be created from these digital sensors in two to three minutes, Jones says.
The sensors generate a lot of data, but so far it hasn’t been overwhelming, according to a recent article in Engineering & Science, a magazine put out by Caltech, which runs the SCSN along with the USGS. An additional 100 sensors are expected to be added this year. But big data pains would follow from a plan to expand the Community Seismic Network, a separate network of 300 sensors in the Pasadena area, by a factor of 100. “Current algorithms aren’t fast enough to deal with that much data,” Mani Chandy, a Caltech computer science professor, says in the publication.
Cause and Effect
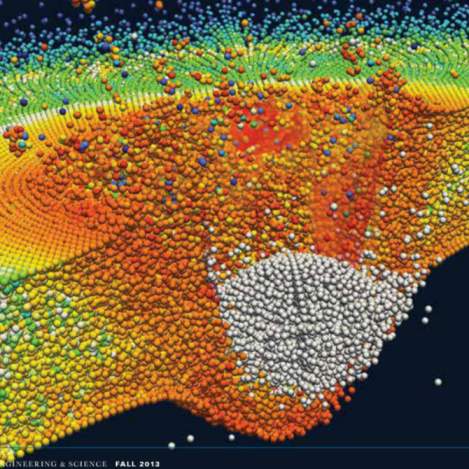
The Northridge quake led to increased funding for earthquake science in the region. The SCEC today has access to supercomputers to crunch seismic data and to simulate half a million earthquakes at about 300 sites throughout the L.A. region. “We have built up in the last 20 years very detailed three-dimensional models,” SCEC director and USC professor Thomas Jordan said during last week’s presentation. “Having these models helps us better understand what the shaking is like.”
For example, the models show that much of the L.A. basin of would shake “like bowl of jelly” during a large earthquake due to the sedimentary layers that make up the ground there, Jordan said. For many of the older buildings in the downtown area, this is a great concern. “This is earthquake country,” Jordan said. “We do in fact have lots of active faults. So our hazard is very high.”
The models also help to show how energy from earthquakes can be funneled due to local geography, which explains why, during the Northridge quake, the Pasadena area to the southeast suffered almost no damage, while the Santa Monica region near the coast more serious damage.
 |
|
| Better mapping and data collection has led to the identificatin of 15 blind thrust faults in SoCal since the Northridge quake in 1994. | |
Since the Northridge quake, scientists have identified about 15 additional blind thrust faults in the Southern California region. This information helps scientists determine how an earthquake on one of those faults might affect people and infrastructure on the surface.
“What you have to do in order to get the earthquake rupture forecast–that is, a forecast of how often, how big and where the earthquakes might occur–is to integrate all of this information together,” Jordan said. “You have to know the faults, the rates of motion and something about the ruptures that occur on them in order to estimate the future probabilities of having earthquakes on these different faults.”
The funding increases due to the Northridge quake has also to led to better presentation of quake-related data to the public. “Now we’re used to going to the Web” after we feel an earthquake, Jones said. “Where do you think that data comes from? It comes from Dr. Jordan’s network.”
State emergency response crews also use the information on the Web to direct resources after an earthquake. “We also have tools now to do a rapid evaluation to tell us what the losses are likely to be due to the event,” Kate Long, earthquake program manager for the California Governor’s Office of Emergency Services, said at the event. Prior to this information being available, emergency response crews relied on “windshield” tests–or police and fireman driving around to survey damage.
All of this data collection, processing, and presentation makes us who live in Southern California safer and more prepared for earthquakes, as a result of stronger building codes and simulation drills, such as the Great Shakeout drills the state periodically holds. But will it prepare us for the Big One? Nobody really knows.
“Those of us who live in South California don’t always like to hear what an exciting natural laboratory South California is for the scientists, but that’s the reality,” Jones said.
Related Items:
Finding Value in Data Through Life Saving Applications
Big IO and the Real Time Future
Datanami Dishes on ‘Big Data’ Predictions for 2014
Applications:
Research Analytics
Technologies:
Middleware
Sectors:
Academia
Vendors:
Startups and More...
Leading Solution Providers


Tabor Network
Sponsored Multimedia


Featured Events
-
Call & Contact Center Expo
 April 24 - April 25Las Vegas NV United States
 -
AI & Big Data Expo North America 2024
 June 5 - June 6Santa Clara CA United States
 -
AI Hardware & Edge AI Summit 2024
 September 10 - September 12San Jose CA United States
 -
CDAO Government 2024
 September 18 - September 19Washington DC United States